
Data Quality Monitoring in Feast 0.64
Serving ML models in production is extremely hard.
The reason is simple: production models depend on data from many different places. Every source system has some probability of operational error: a delayed pipeline, a schema change, a column that starts producing nulls, a categorical value that changes meaning, a late partition, a silent backfill, or a service that behaves differently under production traffic.
The more data sources a model depends on, the more chances there are for one of those systems to drift, fail, or change underneath you. That creates a basic tension in ML systems. Models are data hungry and often benefit from orthogonal features from many upstream systems, but every additional upstream dependency increases operational risk. What ML wants for predictive power can conflict with what engineering wants for reliability.
The only way to manage that tension is to monitor what is actually happening in production. Feature quality problems rarely arrive as neat exceptions. A model may keep serving predictions while one upstream table starts producing nulls, a batch pipeline shifts a numeric distribution, or production requests drift away from the training baseline. By the time these issues show up in model metrics, the debugging path usually crosses feature definitions, data sources, materialization jobs, and serving logs.
Feast 0.64 adds a native data quality monitoring system that brings those signals directly into the feature store. Instead of relying on a separate validation framework, Feast can now compute, store, serve, and visualize feature-level statistics across batch data and logged serving data.
The biggest change is that monitoring is now a first-class Feast workflow:
feast applycan compute baseline metrics for registered feature viewsfeast monitor runcan compute scheduled daily, weekly, biweekly, monthly, and quarterly metrics- REST endpoints expose monitoring jobs, per-feature metrics, aggregate feature-view and feature-service metrics, baselines, and time series
- the Feast UI includes a Monitoring page with filters, summary tabs, feature drilldowns, histograms, and time-series charts
- compute is pushed into supported offline stores where possible, with a Python fallback for other backends
From validation to monitoring
Feast previously supported an external-library-based validation path for historical retrievals. That integration was useful, but it lived outside the normal feature store workflow: users had to install extra dependencies, write profiler code, and run validation against saved datasets.
That original integration proved the need for data quality inside Feast. It helped answer an important question: after generating a training dataset, does this dataset satisfy the expectations we care about?
But production feature quality problems usually happen after the training dataset is generated. A pipeline may keep running while an upstream producer changes a column, shifts a distribution, starts sending nulls, or changes the meaning of a categorical value. In those cases, the feature code may be perfectly correct while the data feeding it has changed.
Feast needed monitoring that was closer to the system that actually computes and serves features. By coupling DQM to Feast’s compute engines and offline stores, Feast can compute quality metrics where the data already lives, reuse feature metadata, compare batch and serving-log distributions, and expose the results through the same CLI, REST API, and UI used to operate the feature store.
This also helps when teams maintain multiple feature execution paths. For example, a feature may be generated one way for training and another way for low-latency serving or streaming. DQM is not a formal proof that two implementations are equivalent, but distribution metrics, baselines, and serving-log comparisons provide an early warning when those paths start producing meaningfully different values.
The new system is broader and more operational. It automatically computes statistical profiles for registered features, stores them in monitoring tables, and makes them available to the CLI, REST API, and UI. This gives teams the kind of feature health view they need after features are already in production, not only during one historical retrieval.
For each feature, Feast can track:
| Metric family | Examples |
|---|---|
| completeness | row count, null count, null rate |
| numeric profile | mean, standard deviation, min, max |
| percentiles | p50, p75, p90, p95, p99 |
| distributions | numeric histograms or categorical top values |
| aggregate health | feature-view and feature-service summaries |
Baselines start at registration
The simplest way to turn on monitoring is to enable DQM in feature_store.yaml:
data_quality_monitoring:
  auto_baseline: true
When auto_baseline is enabled, feast apply computes baseline metrics for feature views that do not already have one. The baseline is marked as the reference distribution and can be compared with later scheduled metrics.
That matters because the baseline lives next to the feature definitions. When a feature view is registered, Feast can also capture what “normal” looked like at registration time. Later monitoring runs can answer whether the current data still resembles that baseline.
For Feast Operator deployments, the same setting is available on the FeatureStore custom resource:
apiVersion: feast.dev/v1
kind: FeatureStore
spec:
  feastProject: my_project
  dataQualityMonitoring:
    autoBaseline: true
Scheduled monitoring with the CLI
For ongoing monitoring, schedule:
feast monitor runIn auto mode, Feast detects the latest event timestamp in the source data and computes metrics across the supported granularities: daily, weekly, biweekly, monthly, and quarterly.
You can also scope monitoring to a specific feature view:
feast monitor run --feature-view driver_statsOr compute a specific window and mark it as a baseline:
feast monitor run \
  --feature-view driver_stats \
  --start-date 2025-01-01 \
  --end-date 2025-03-31 \
  --granularity daily \
  --set-baseline
This makes the CLI easy to wire into Airflow, Kubeflow Pipelines, cron, or any scheduler that already runs Feast materialization jobs.
Monitoring serving logs
Batch data tells you whether source features look healthy. Serving logs tell you what your models actually received.
If a FeatureService has logging configured, Feast can compute monitoring metrics from the logged online features:
feast monitor run --source-type logYou can also run batch and log monitoring together:
feast monitor run --source-type allLog metrics are stored with data_source_type="log" alongside batch metrics. Feast normalizes logged feature names back to the feature view and feature name, which lets the UI and API compare batch and serving distributions without forcing users to maintain a separate mapping.
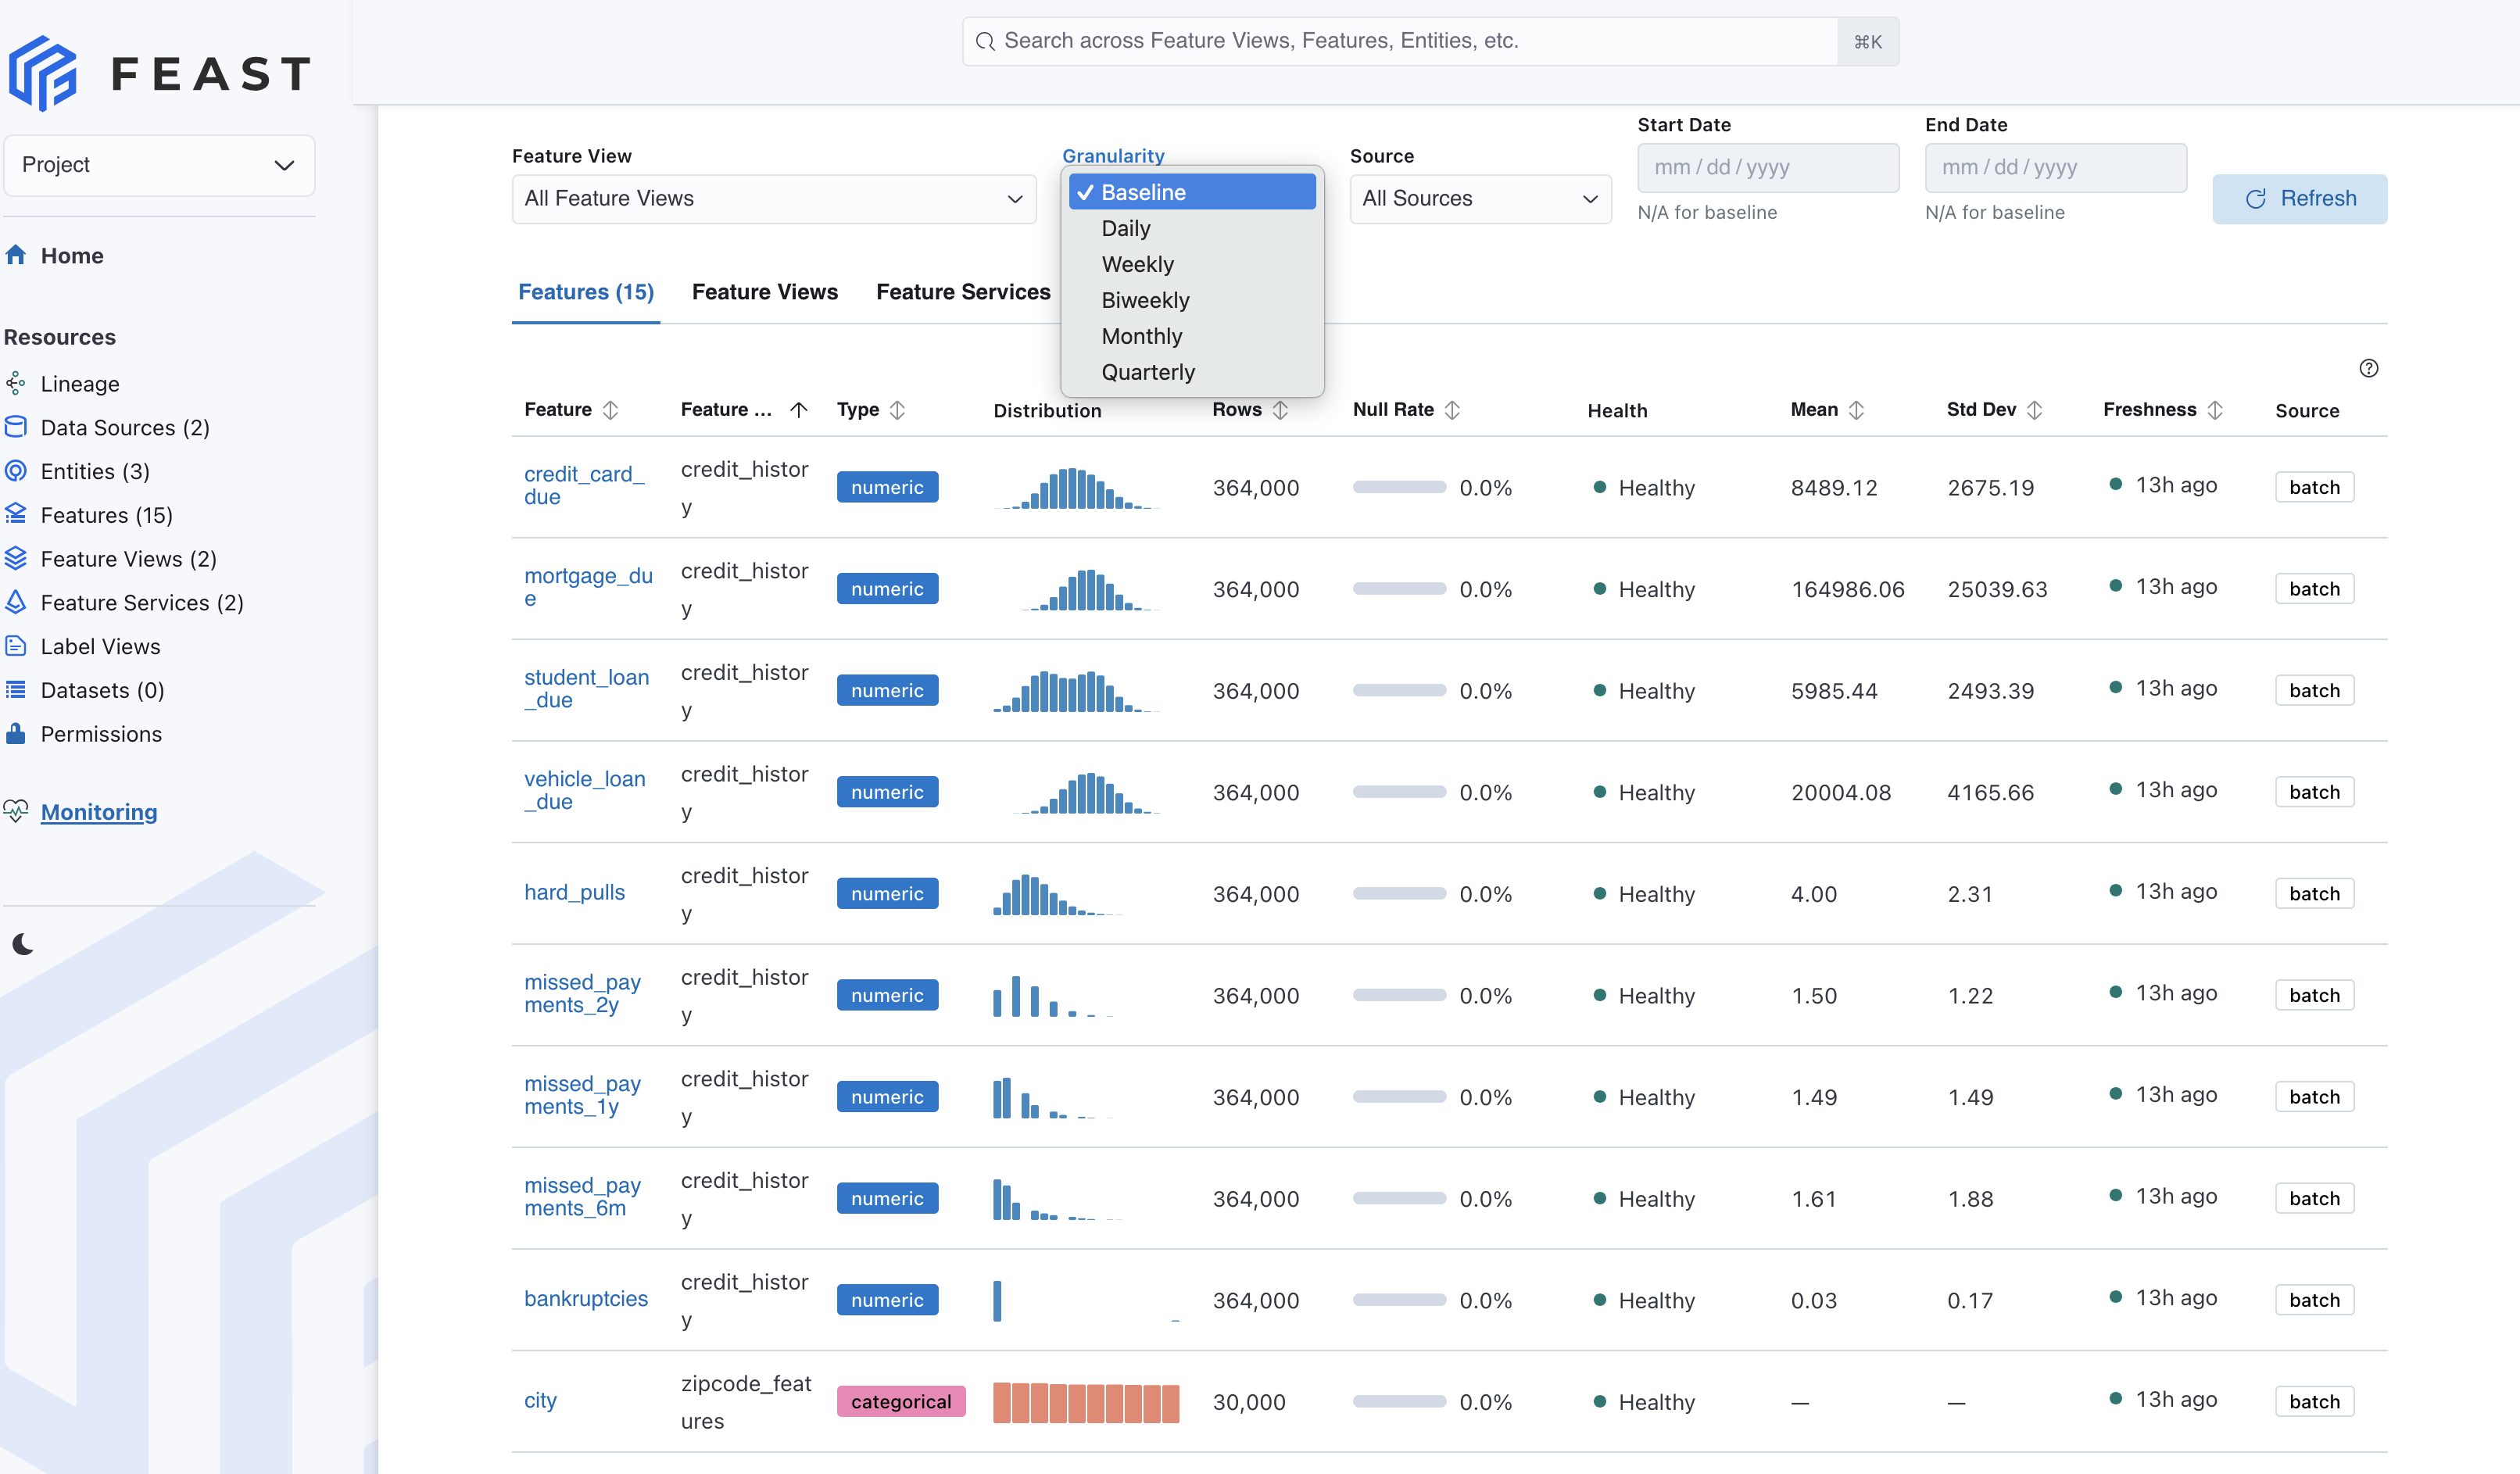
The new Monitoring UI
The most visible 0.64 improvement is the Monitoring page in the Feast UI. It turns DQM from a background job into something feature owners can inspect without leaving Feast.
The page includes three main tabs:
| Tab | What it shows |
|---|---|
| Features | per-feature metrics such as null rate, row count, freshness, and health |
| Feature Views | aggregate quality summaries per feature view |
| Feature Services | aggregate quality summaries for model-facing feature services |
At the top of the page, users can filter by feature view, granularity, source type, and date range. Baseline is treated as its own view because it represents all baseline data rather than a normal date window. The page also includes a Compute Metrics action that triggers DQM computation from the UI, plus Refresh for reloading already computed results.
Clicking a feature opens a detail page with:
- a distribution chart for numeric histograms or categorical values
- a statistics panel with null rate, mean, standard deviation, min, max, and percentiles
- a granularity selector that can switch between computed windows and baseline
- time-series charts for metric drift, including aggregate statistics and null-rate trends
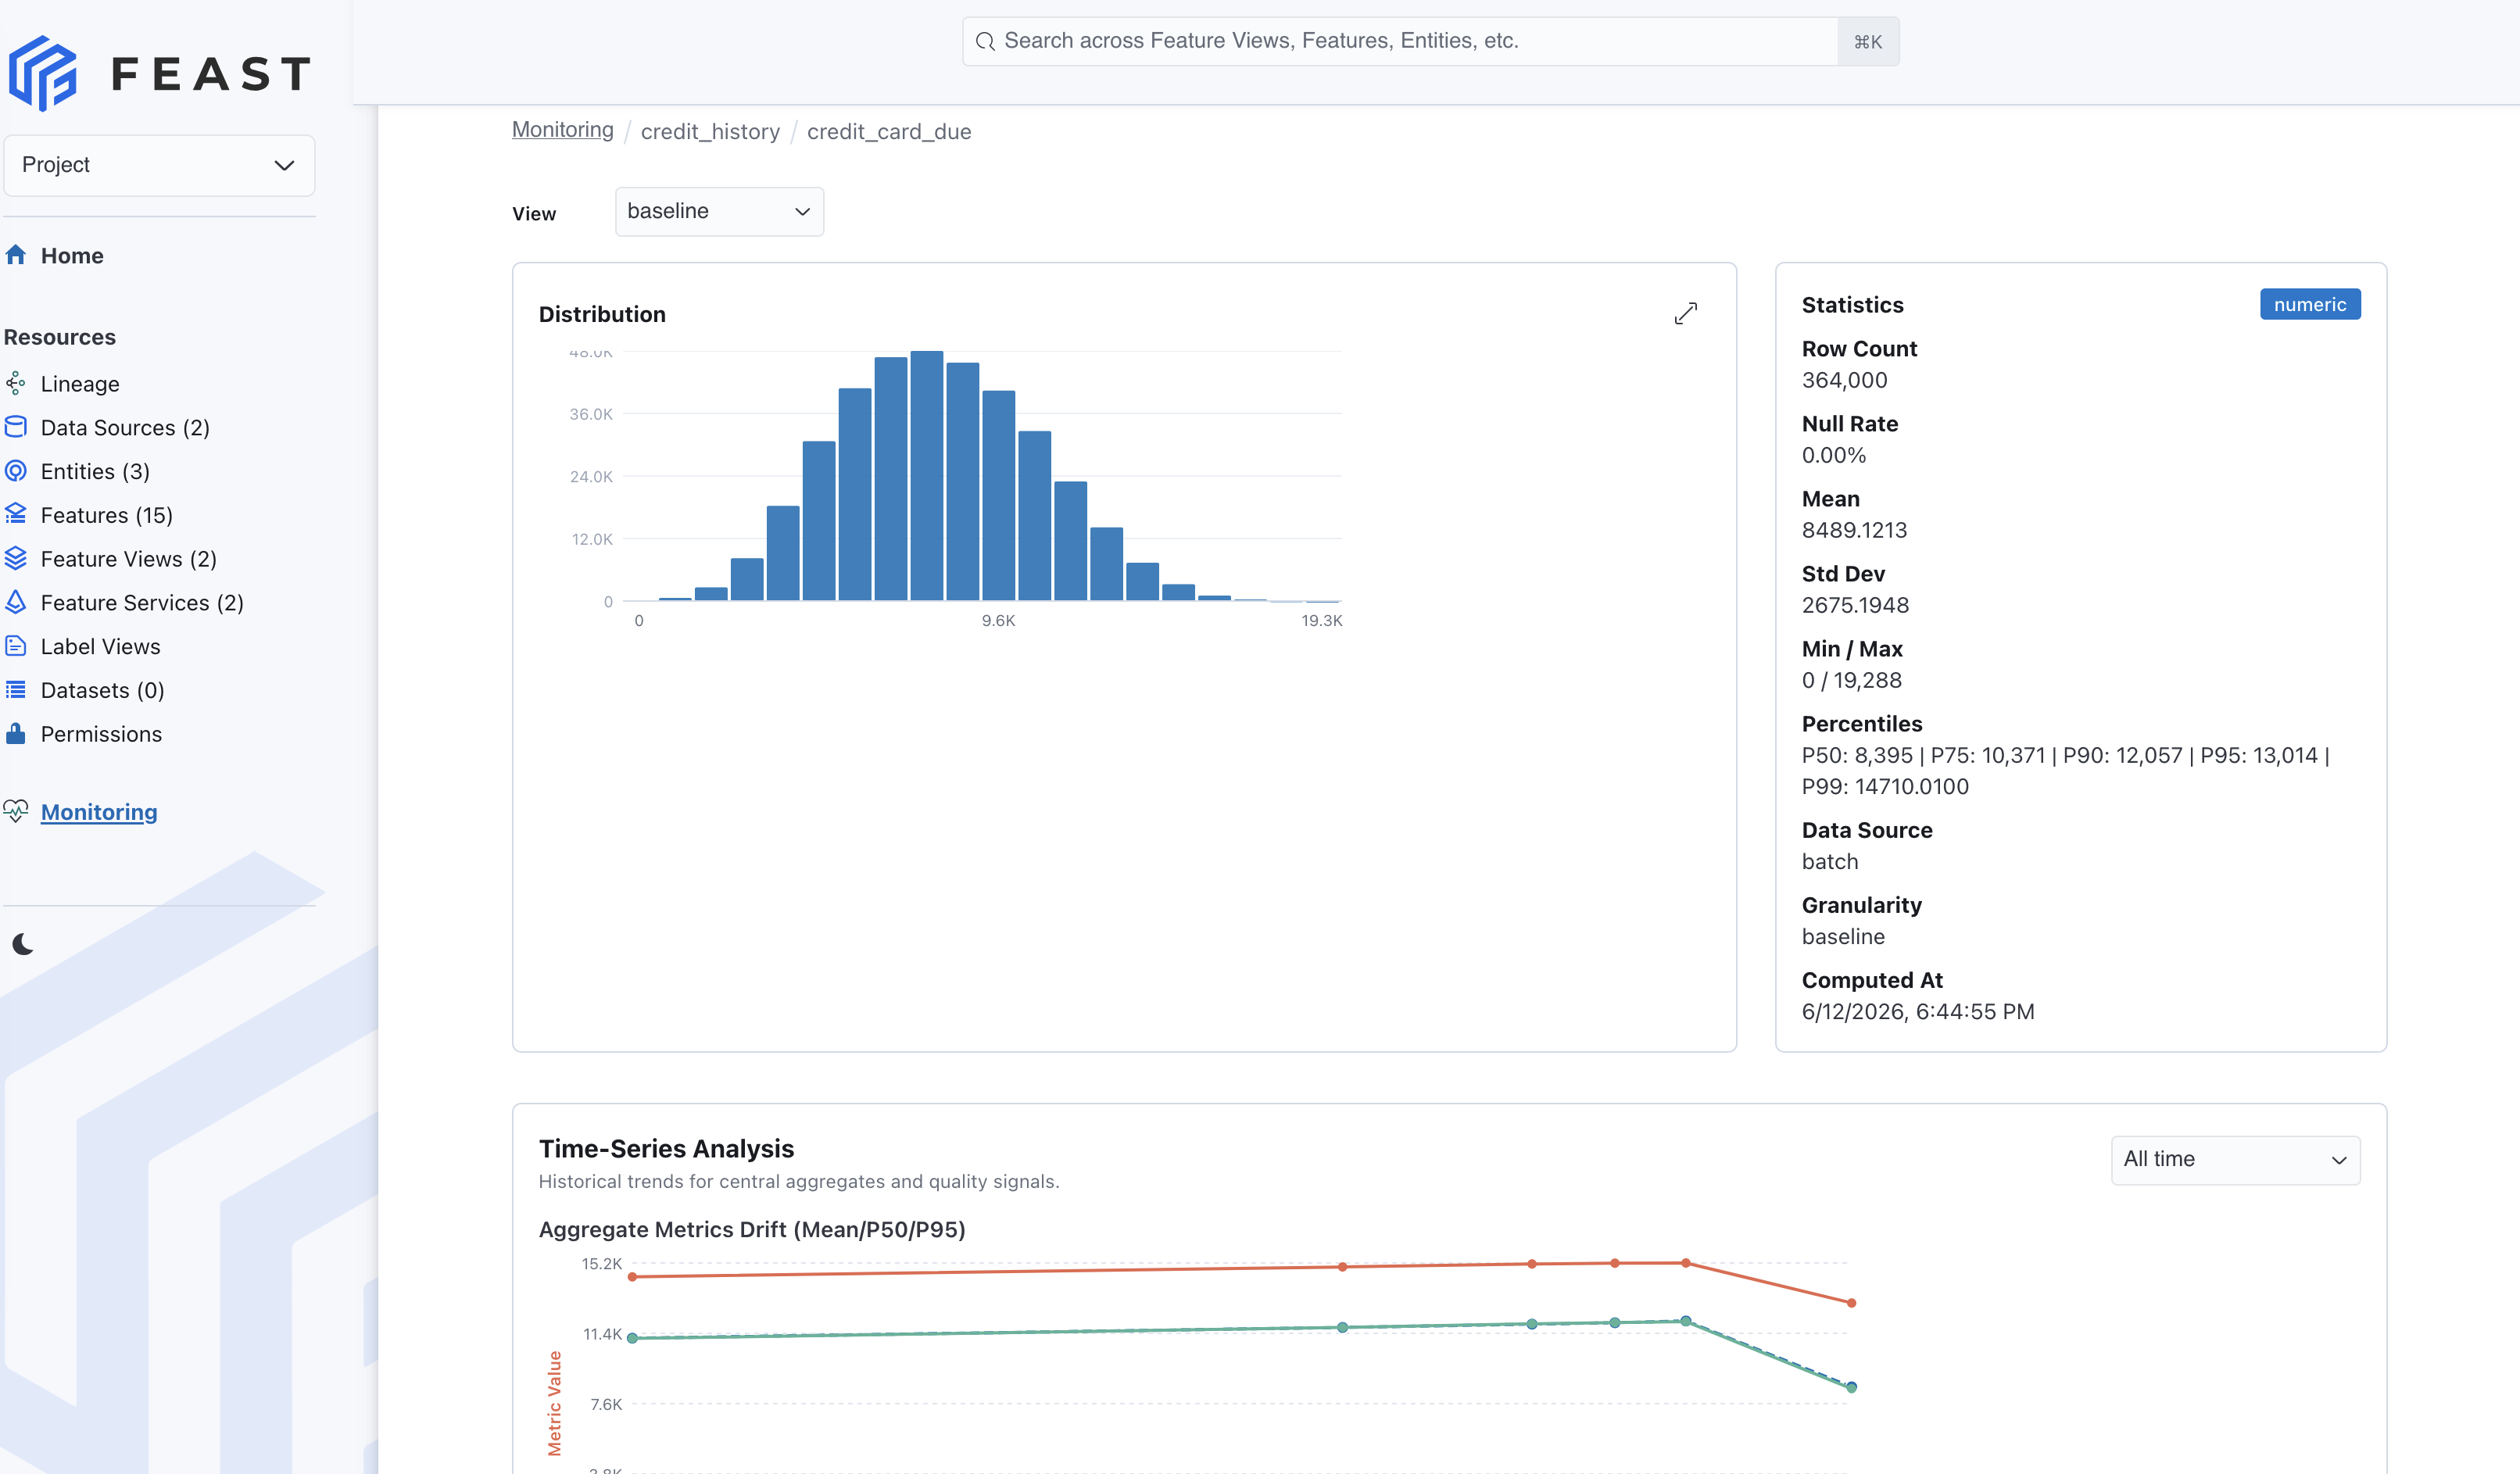
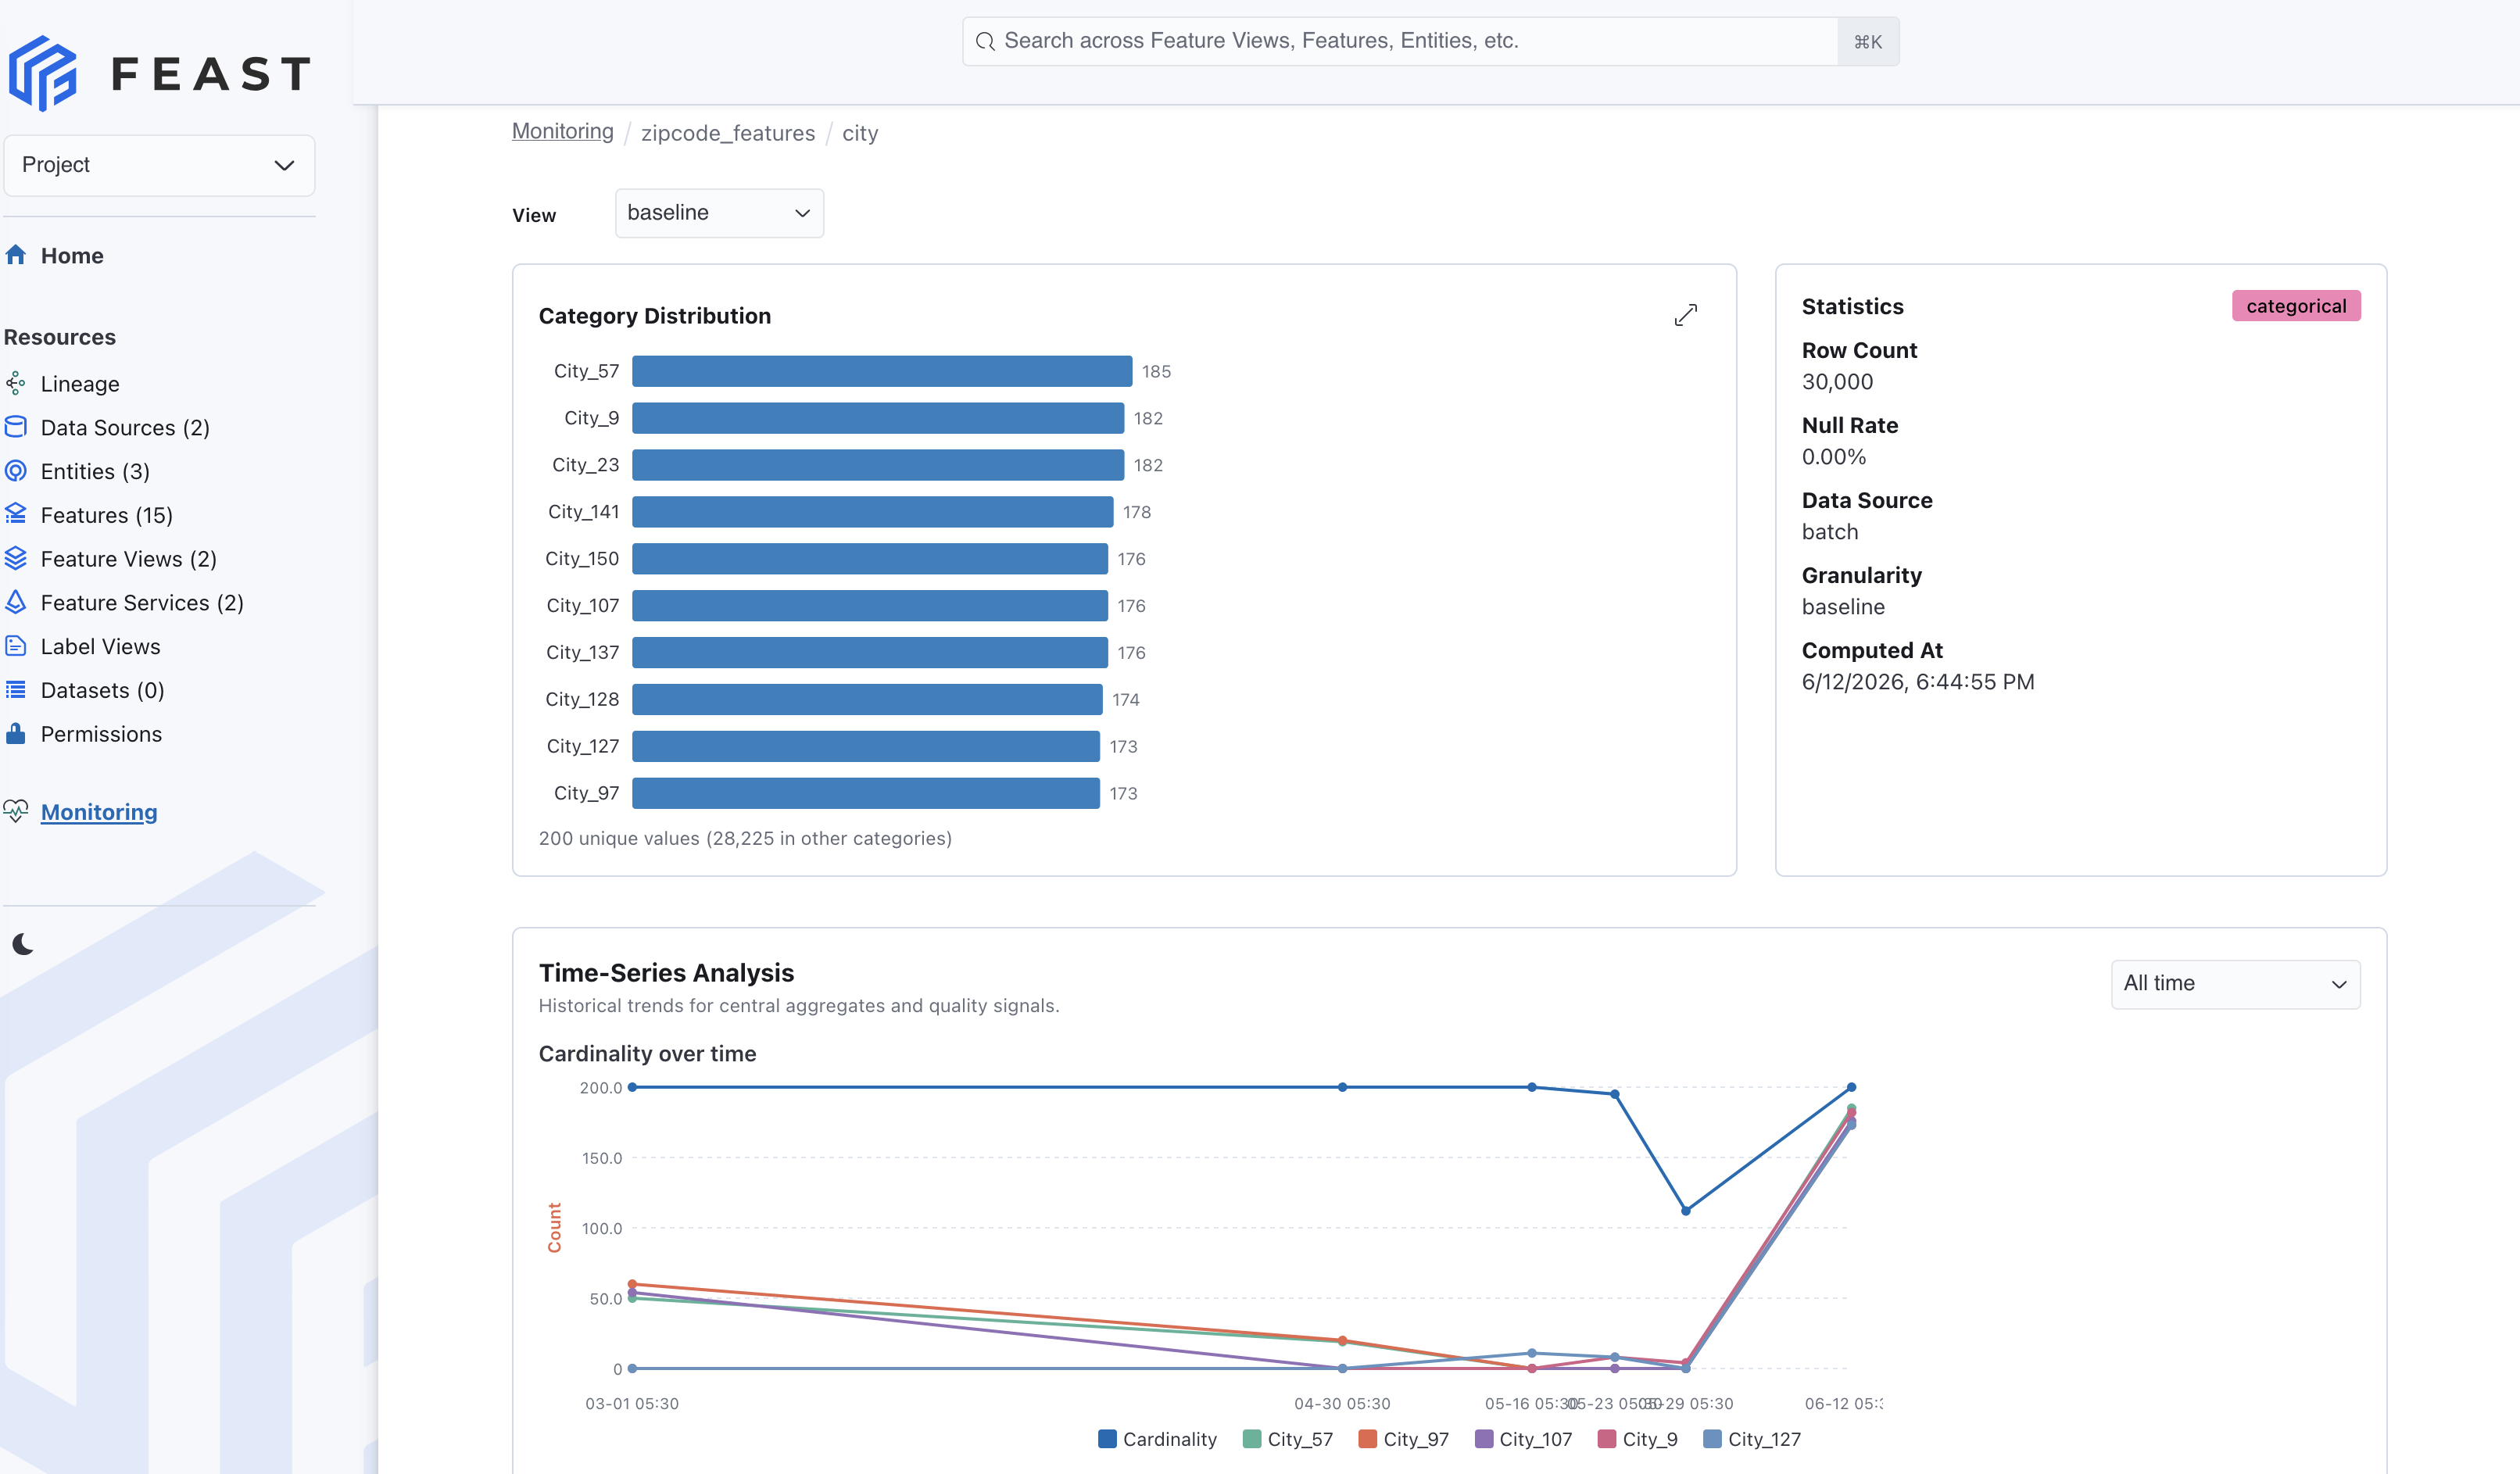
This is the workflow we wanted: feature owners can start from a table of health signals, filter down to the part of the feature store they care about, and then drill into the exact feature whose distribution changed.
How compute engines fit in
DQM is intentionally tied to Feast’s compute and offline-store architecture. The goal is to compute metrics where the data already lives whenever possible, then store the results in backend-specific monitoring tables.
Supported backends push computation into the underlying system:
| Backend | Compute path | Storage path |
|---|---|---|
| PostgreSQL | SQL push-down | INSERT ON CONFLICT |
| Snowflake | SQL push-down | MERGE with JSON metrics |
| BigQuery | SQL push-down | BigQuery MERGE |
| Redshift | SQL push-down | Data API-backed writes |
| Spark | SparkSQL push-down | Parquet-backed tables |
| Oracle | SQL through Ibis | MERGE |
| DuckDB | in-memory SQL | Parquet files |
| Dask | PyArrow compute | Parquet files |
For backends without native monitoring support, Feast falls back to pulling data through the offline store and computing metrics with PyArrow and NumPy. That fallback keeps the API consistent while still allowing mature warehouse and distributed engines to do the heavy lifting.
This design is especially important for larger feature stores. A null-rate or histogram job should not require exporting a warehouse table into a separate monitoring system. If the feature data already lives in Snowflake, BigQuery, Spark, Redshift, or another supported backend, Feast can push the computation closer to that data.
Feast 0.64 also adds the Apache Flink compute engine, continuing the broader move toward a unified compute-engine model. DQM follows the same direction: feature quality checks should be part of the feature platform’s execution model, not a sidecar that every team wires up differently.
REST APIs for automation
The UI and CLI are built on top of monitoring APIs that can also be used by external systems:
| Method | Endpoint | Use |
|---|---|---|
POST | /monitoring/compute | submit a batch DQM job |
POST | /monitoring/auto_compute | auto-detect dates and compute all granularities |
POST | /monitoring/compute/transient | compute ad hoc metrics without storing them |
POST | /monitoring/compute/log | compute metrics from serving logs |
POST | /monitoring/auto_compute/log | auto-compute log metrics |
GET | /monitoring/jobs/{job_id} | read DQM job status |
GET | /monitoring/metrics/features | read per-feature metrics |
GET | /monitoring/metrics/feature_views | read feature-view summaries |
GET | /monitoring/metrics/feature_services | read feature-service summaries |
GET | /monitoring/metrics/baseline | read baseline metrics |
GET | /monitoring/metrics/timeseries | read trend data for charts and alerts |
The transient compute endpoint is useful for exploration. If someone wants to inspect a very specific date range, Feast can compute fresh metrics and return them directly without storing them as part of the scheduled monitoring history.
Production shape
A typical production setup now looks like this:
- Add
data_quality_monitoring.auto_baseline: truetofeature_store.yaml - Run
feast applyto register features and compute baseline metrics - Schedule
feast monitor runfor batch metrics - Enable feature-service logging and schedule
feast monitor run --source-type logfor production serving metrics - Use the UI to investigate feature health and distribution changes
- Use REST APIs to connect monitoring results to alerting, orchestration, or custom dashboards
Monitoring also respects Feast’s existing authorization model. Compute operations require update permissions, while reads and transient exploration require describe permissions. That keeps the new DQM surface aligned with the rest of the registry and feature-store API.
What’s next
Feast 0.64 makes DQM part of the feature store instead of an integration around it. The release adds the backend compute path, the CLI, the REST API, and the UI surface in one coherent workflow.
The next step for users is simple: enable baselines, run monitoring jobs on the same cadence as your data pipelines, and use the UI to make feature quality visible to the teams that own production models.
For setup details, see the Feature Quality Monitoring guide and the 0.64.0 changelog.