Monitoring Your Feast Feature Server with Prometheus and Grafana
As feature stores become a critical part of production ML systems, the question shifts from “Can I serve features?” to “Can I trust what I’m serving?”. Are my features fresh? Is latency within SLA? Are materialization pipelines succeeding? How long are my on-demand transformations taking?
Until now, answering these questions for Feast required ad-hoc monitoring — parsing logs, writing custom health checks, or bolting on external instrumentation. That changes today.
Feast now ships built-in Prometheus metrics for the feature server, covering the full request lifecycle — from HTTP request handling through online store reads and on-demand feature transformations to materialization pipelines and feature freshness tracking. Enable it with a single flag, point Prometheus at the metrics endpoint, and get production-grade observability for your feature serving infrastructure.
This post walks through the metrics available, what each one tells you, how to enable and configure them, and how to build a Grafana dashboard that gives you a complete operational picture of your feature server.
What’s New
Feast’s feature server now exposes a comprehensive set of Prometheus metrics across seven categories, designed to give ML platform teams full visibility into their feature serving infrastructure:
- Request metrics — Per-endpoint request counters and latency histograms with
feature_countandfeature_view_countlabels, so you can correlate latency with request complexity. - Online store read duration — A histogram capturing total time spent reading from the online store (Redis, DynamoDB, PostgreSQL, etc.), covering both synchronous and async paths across all backends.
- ODFV transformation duration — Per-ODFV histograms for both read-path (during
/get-online-features) and write-path (during push/materialize) transformations, withodfv_nameandmodelabels to compare Pandas vs Python vs Substrait performance. - Online feature retrieval counters — Request counts and entity-row-per-request histograms, revealing the shape of your traffic.
- Push counters — Tracked by push source and mode (online/offline/both), giving early warning when ingestion pipelines stop sending data.
- Materialization tracking — Success/failure counters and duration histograms per feature view, so you know immediately when a pipeline breaks.
- Feature freshness gauges — Per-feature-view staleness (seconds since last materialization), updated by a background thread every 30 seconds. The single most important metric for ML model quality.
- CPU and memory gauges — Per-worker resource usage for capacity planning and leak detection.
- Kubernetes-native discovery — The Feast Operator auto-generates a
ServiceMonitorwhen metrics are enabled, so Prometheus Operator discovers the scrape target automatically.
All metrics are fully opt-in with zero overhead when disabled. Per-category toggles let you enable exactly the metrics you need.
Enabling Metrics
CLI: One Flag
The simplest way — one flag, everything enabled:
feast serve --metricsThis starts the feature server on its default port (6566) and a Prometheus metrics endpoint on port 8000.
YAML: Fine-Grained Control
For production deployments, configure metrics in feature_store.yaml with per-category toggles:
feature_server:
  metrics:
    enabled: true
    resource: true           # CPU and memory gauges
    request: true            # HTTP request counters and latency histograms
    online_features: true    # Entity count and retrieval tracking
    push: true               # Push/ingestion request counters
    materialization: true    # Pipeline success/failure and duration
    freshness: true          # Per-feature-view data staleness
Kubernetes: Feast Operator
If you’re running Feast on Kubernetes with the Feast Operator, set metrics: true on the online store server:
apiVersion: feast.dev/v1alpha1
kind: FeatureStore
metadata:
  name: production-feast
spec:
  feastProject: my_project
  services:
    onlineStore:
      server:
        metrics: true
The operator automatically appends --metrics to the serve command and exposes port 8000 as a metrics port on the Service. It also auto-generates a ServiceMonitor resource for Prometheus Operator discovery. The operator detects the monitoring.coreos.com API group at startup; if the Prometheus Operator CRD is absent, ServiceMonitor creation is silently skipped, so vanilla Kubernetes clusters are unaffected.
The Metrics
Feast exposes metrics across seven categories. Here’s the full reference, organized by what each category helps you answer.
Request Metrics — “How is my API performing?”
| Metric | Type | Labels |
|---|---|---|
feast_feature_server_request_total | Counter | endpoint, status |
feast_feature_server_request_latency_seconds | Histogram | endpoint, feature_count, feature_view_count |
These are the core RED metrics (Rate, Errors, Duration) for your feature server. The latency histogram includes feature_count and feature_view_count labels so you can correlate latency with request complexity — a request fetching 200 features from 15 feature views will naturally be slower than one fetching 5 features from 2 views.
The histogram uses bucket boundaries tuned for feature serving workloads: 5ms, 10ms, 25ms, 50ms, 100ms, 250ms, 500ms, 1s, 2.5s, 5s, 10s. Most online feature requests should complete in the lower buckets.
Online Feature Retrieval — “What does my traffic look like?”
| Metric | Type | Labels |
|---|---|---|
feast_online_features_request_total | Counter | — |
feast_online_features_entity_count | Histogram | — |
The entity count histogram (buckets: 1, 5, 10, 25, 50, 100, 250, 500, 1000) tells you the shape of your traffic. Are callers sending single-entity lookups (real-time inference) or batch requests of hundreds (batch scoring)? A sudden spike in entity count per request means an upstream service changed its batching strategy — this directly impacts latency and memory.
Online Store Read Duration — “Where is my latency coming from?”
| Metric | Type | Labels |
|---|---|---|
feast_feature_server_online_store_read_duration_seconds | Histogram | — |
This metric captures the total time spent reading from the online store (Redis, DynamoDB, PostgreSQL, etc.) during a /get-online-features request. It covers both the synchronous for-loop path and the async asyncio.gather path across all backends.
By comparing this with the overall request latency, you can determine whether latency is dominated by the store read or by other processing (serialization, transformation, network overhead).
ODFV Transformation Duration — “How expensive are my transforms?”
| Metric | Type | Labels |
|---|---|---|
feast_feature_server_transformation_duration_seconds | Histogram | odfv_name, mode |
feast_feature_server_write_transformation_duration_seconds | Histogram | odfv_name, mode |
These metrics capture per-ODFV transformation time for both read-path (during /get-online-features) and write-path (during push/materialize with write_to_online_store=True) operations. The mode label distinguishes pandas, python, and substrait transformation modes, making it easy to compare their performance characteristics side by side.
ODFV transformation metrics are opt-in at the definition level via track_metrics=True:
@on_demand_feature_view(
    sources=[driver_stats_fv, input_request],
    schema=[Field(name="conv_rate_plus_val1", dtype=Float64)],
    mode="python",
    track_metrics=True,   # Enable Prometheus metrics for this ODFV
)
def transformed_conv_rate_python(inputs: Dict[str, Any]) -> Dict[str, Any]:
    return {"conv_rate_plus_val1": inputs["conv_rate"] + inputs["val_to_add"]}
When track_metrics=False (the default), zero metrics code runs for that ODFV — no timing, no Prometheus recording. This lets you selectively instrument the transforms you care about without adding overhead to others.
Push Metrics — “Is my ingestion pipeline healthy?”
| Metric | Type | Labels |
|---|---|---|
feast_push_request_total | Counter | push_source, mode |
The push_source label identifies which source is pushing data. The mode label is one of online, offline, or online_and_offline. A push source that stops sending data is an early signal that an upstream pipeline is broken — long before feature staleness becomes visible.
Materialization Metrics — “Are my pipelines succeeding?”
| Metric | Type | Labels |
|---|---|---|
feast_materialization_total | Counter | feature_view, status |
feast_materialization_duration_seconds | Histogram | feature_view |
The status label is success or failure. The duration histogram uses wide buckets (1s, 5s, 10s, 30s, 60s, 2min, 5min, 10min, 30min, 1hr) because materialization jobs can range from seconds to tens of minutes depending on the feature view size and offline store.
Feature Freshness — “How stale is my data?”
| Metric | Type | Labels |
|---|---|---|
feast_feature_freshness_seconds | Gauge | feature_view, project |
This is the single most important metric for ML teams. It measures data staleness — the gap between “now” and the last successful materialization end time — per feature view. A background thread computes this every 30 seconds.
If your model was trained on hourly features and the freshness gauge crosses 2 hours, your model is receiving data it has never seen patterns for. Before this metric existed, this was a silent failure. Now you can set an alert and catch it in minutes.
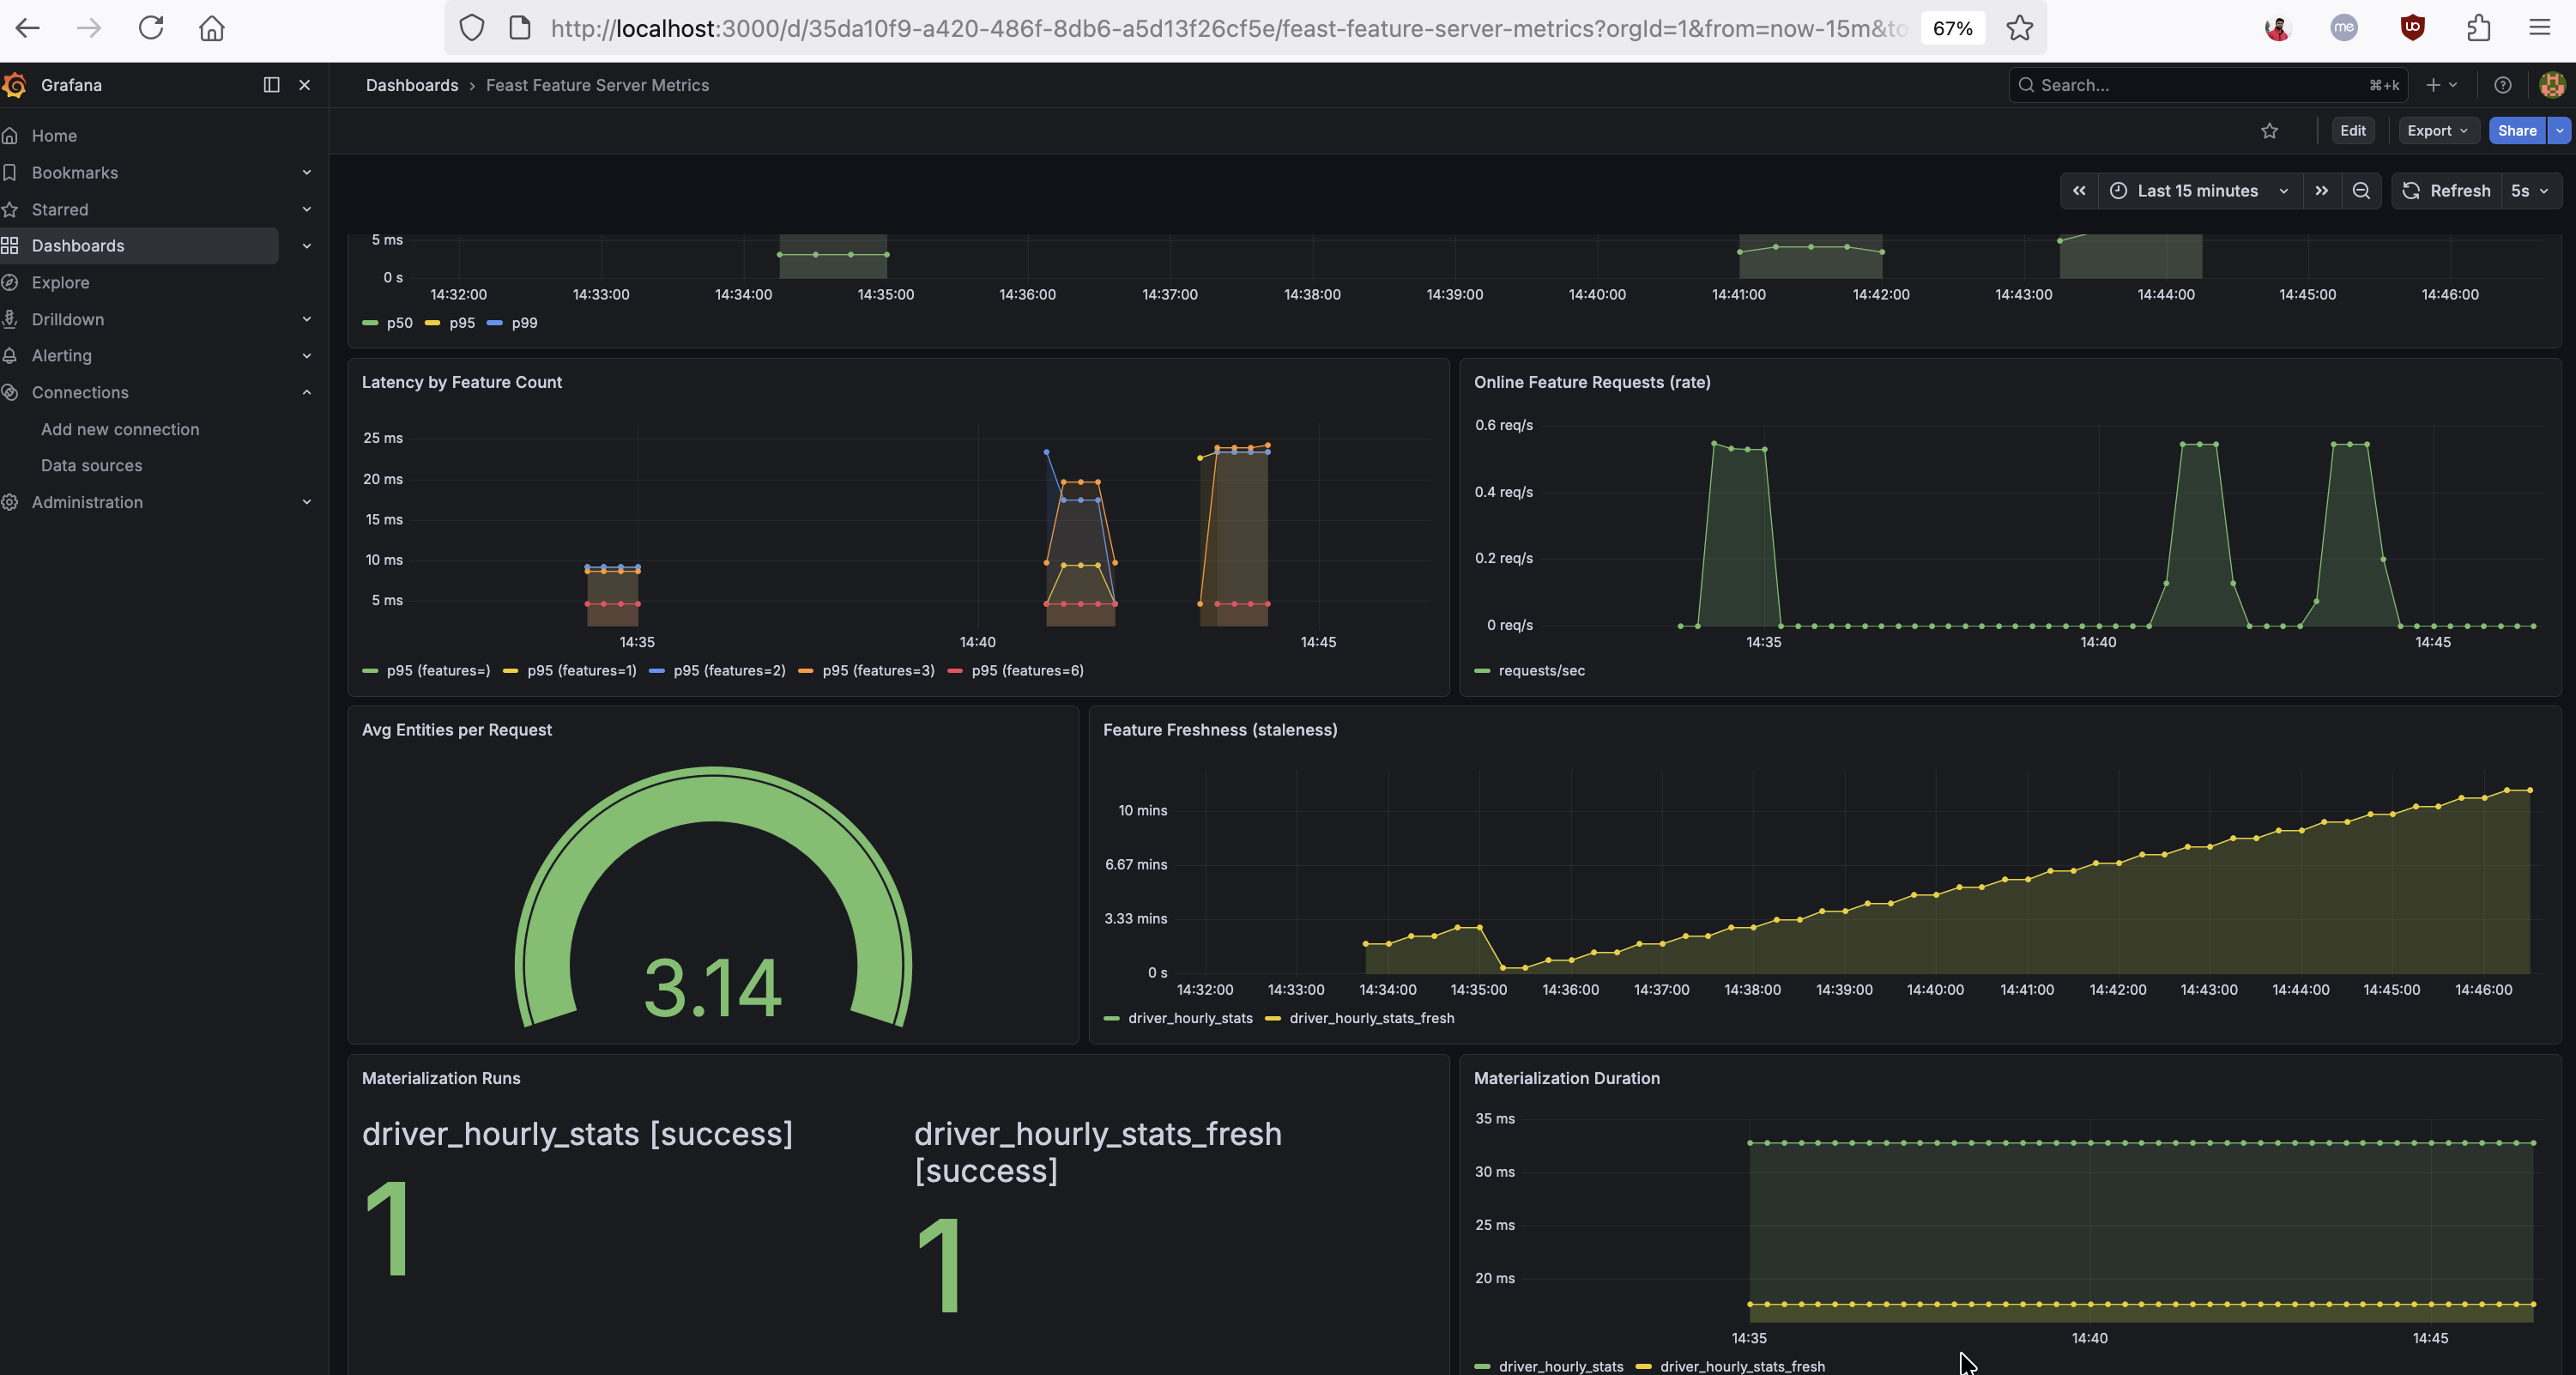
The dashboard below shows these ML-specific metrics in action — latency correlated with feature count, online feature request rate, average entities per request, feature freshness per feature view, and materialization success counts with duration:
Resource Metrics — “Is my server healthy?”
| Metric | Type | Labels |
|---|---|---|
feast_feature_server_cpu_usage | Gauge | (per worker PID) |
feast_feature_server_memory_usage | Gauge | (per worker PID) |
Per-worker CPU and memory gauges, updated every 5 seconds by a background thread. In Gunicorn deployments, each worker reports independently, so you can spot an individual worker consuming excessive resources.
Latency Breakdown: Understanding Where Time Is Spent
One of the most powerful uses of these metrics is latency decomposition. By overlaying the overall request latency with the online store read duration and ODFV transformation duration, you can pinpoint exactly where time is spent:
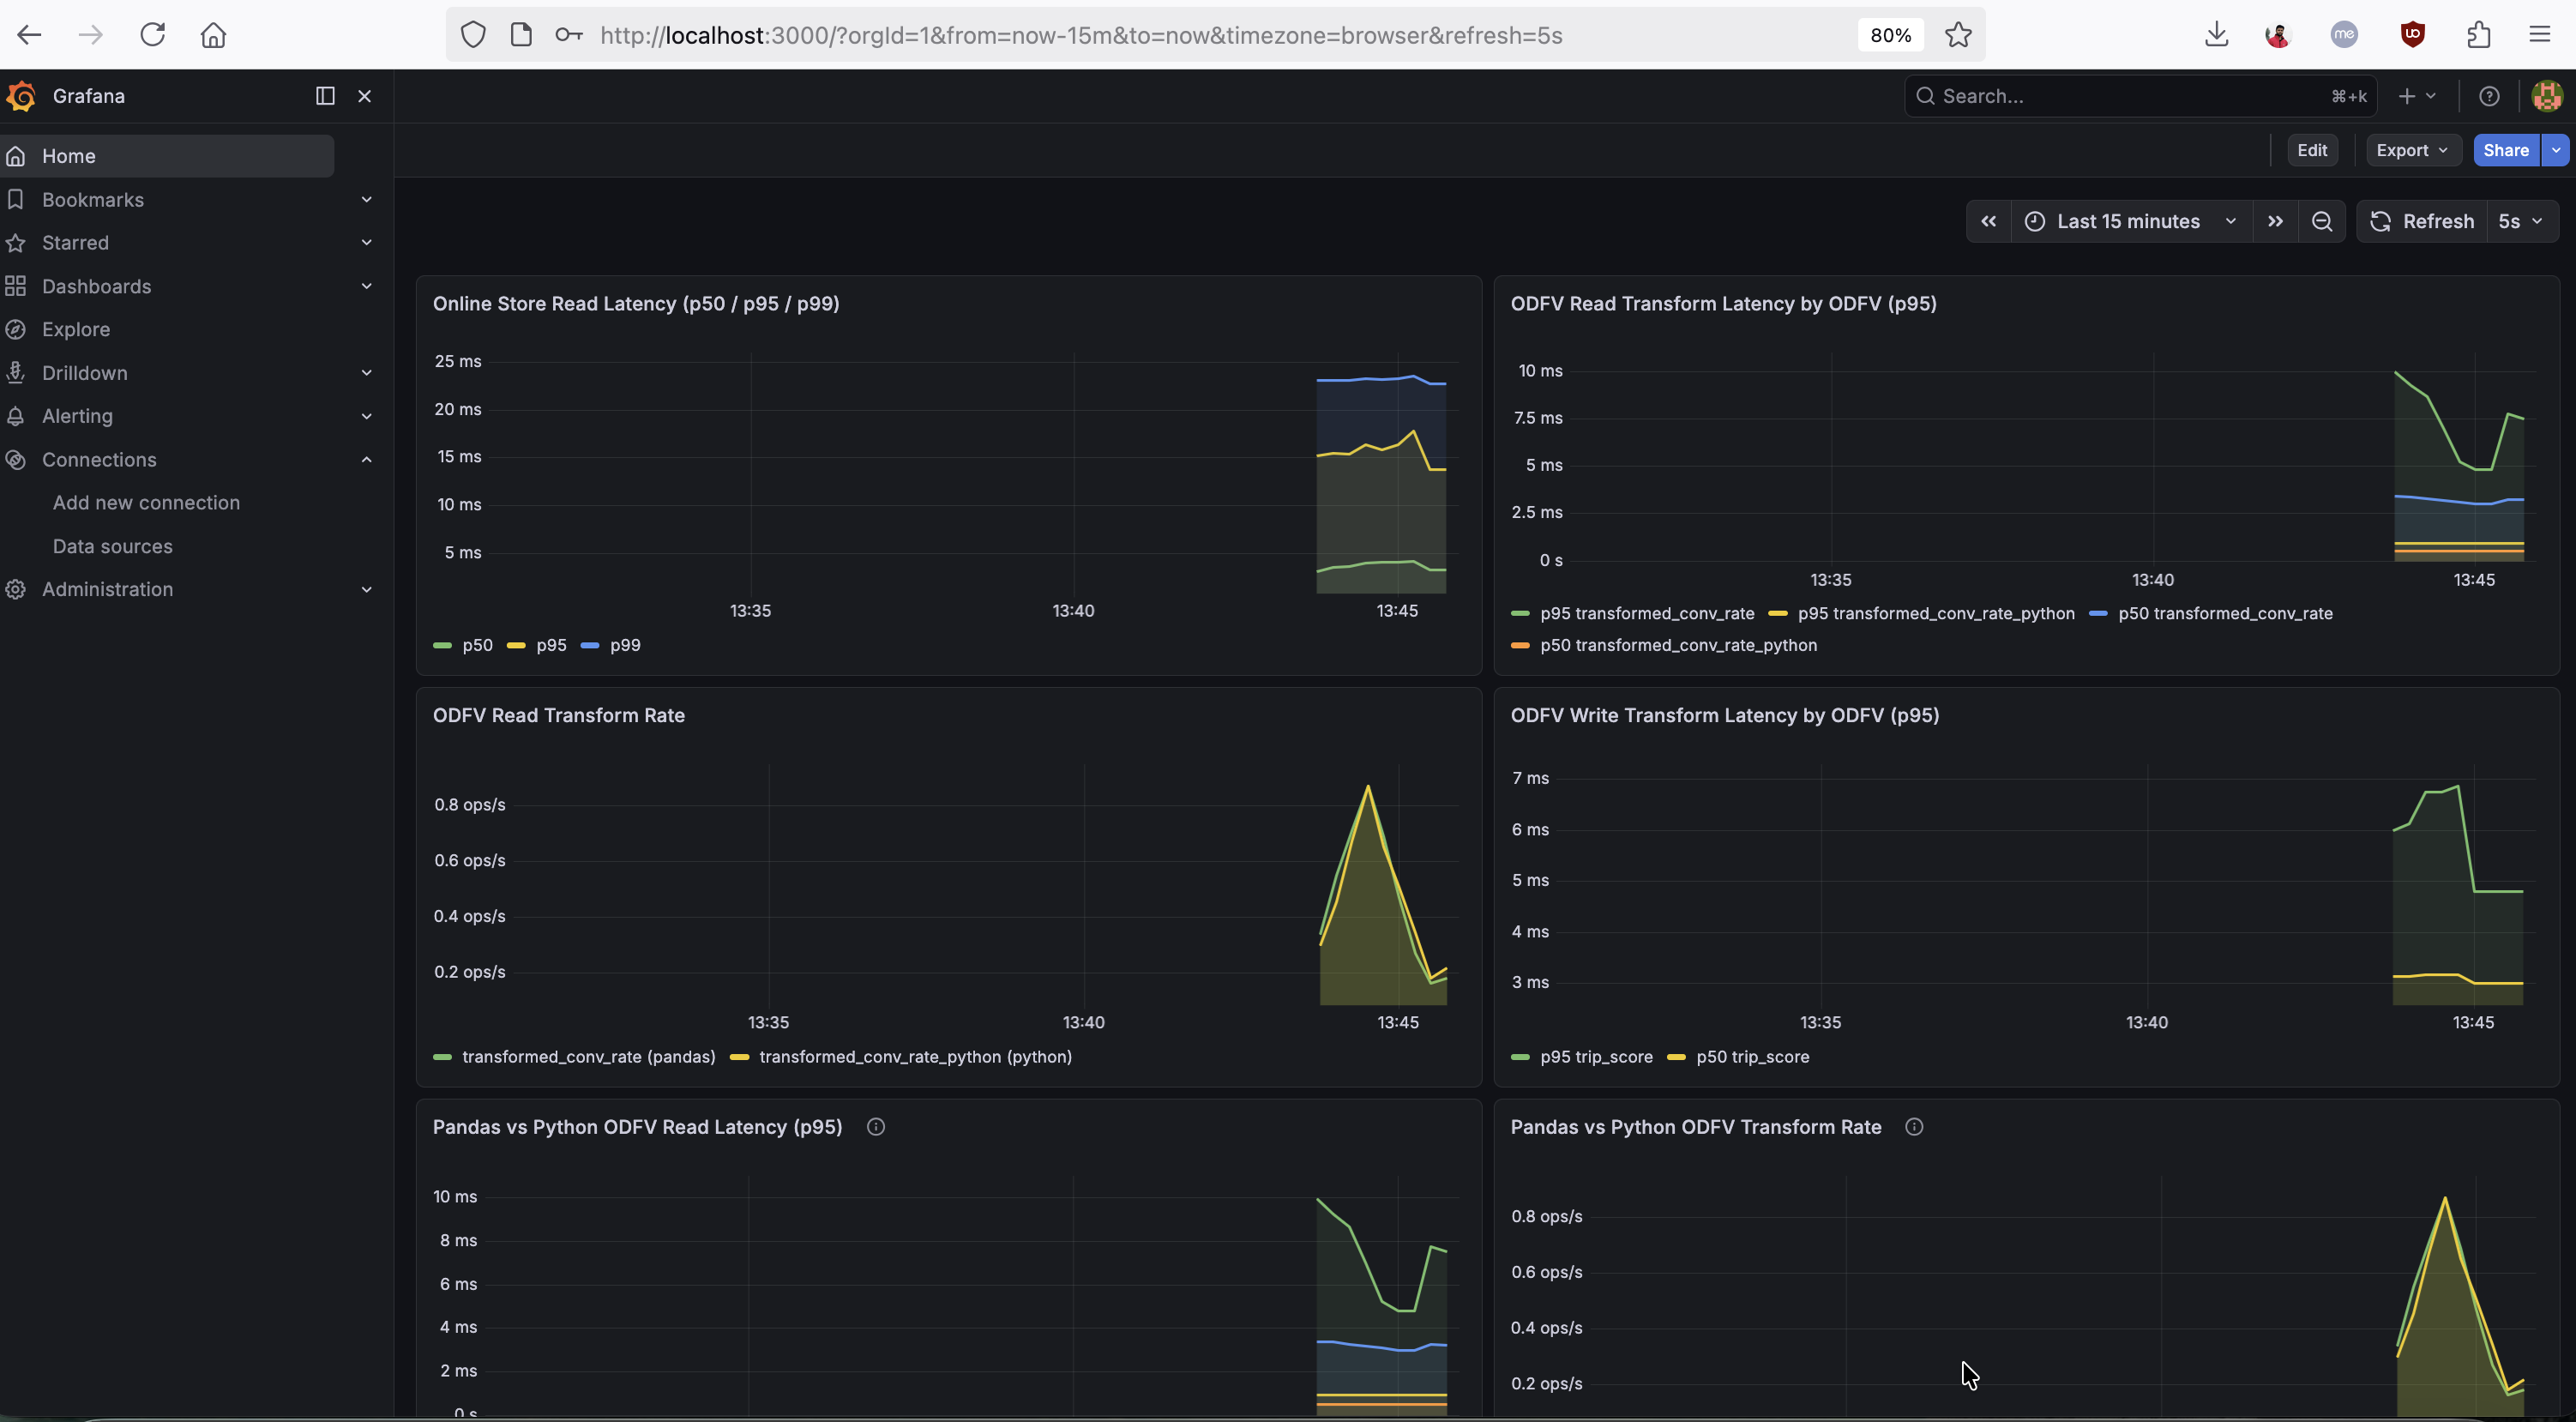
Total request latency = Store read + ODFV transforms + Serialization/overheadThe Grafana dashboard below shows this decomposition in action — online store read latency (p50/p95/p99), per-ODFV read-path and write-path transform latency, and a side-by-side Pandas vs Python ODFV comparison:
If store reads dominate, the bottleneck is your online store (consider Redis instead of PostgreSQL, or tune your connection pool). If ODFV transforms dominate, consider switching from Pandas mode to Python mode — or re-evaluate whether the transformation should be precomputed during materialization instead of computed on the fly.
Pandas vs Python ODFV Comparison
The mode label on transformation metrics makes it straightforward to compare Pandas and Python ODFV performance. The bottom-left panel in the dashboard above shows p50/p95 latencies for Pandas-mode and Python-mode ODFVs overlaid, making the comparison immediate. You can also query these directly:
# Pandas p95 read-path latency
histogram_quantile(0.95,
  sum(rate(feast_feature_server_transformation_duration_seconds_bucket{mode="pandas"}[1m])) by (le))

# Python p95 read-path latency
histogram_quantile(0.95,
  sum(rate(feast_feature_server_transformation_duration_seconds_bucket{mode="python"}[1m])) by (le))
Building Alerts
Here are the recommended alert rules, ordered by impact:
Feature Freshness SLO Breach
- alert: FeastFeatureViewStale
  expr: feast_feature_freshness_seconds > 3600
  for: 5m
  labels:
    severity: critical
  annotations:
    summary: >
      Feature view {{ $labels.feature_view }} in project {{ $labels.project }}
      has not been materialized in {{ $value | humanizeDuration }}.
    impact: Models consuming this feature view are receiving stale data.
Materialization Failures
- alert: FeastMaterializationFailing
  expr: rate(feast_materialization_total{status="failure"}[15m]) > 0
  for: 5m
  labels:
    severity: critical
  annotations:
    summary: >
      Materialization is failing for feature view {{ $labels.feature_view }}.
High p99 Latency
- alert: FeastHighLatency
  expr: |
    histogram_quantile(0.99,
      rate(feast_feature_server_request_latency_seconds_bucket{
        endpoint="/get-online-features"
      }[5m])
    ) > 1.0
  for: 5m
  labels:
    severity: warning
  annotations:
    summary: >
      Feast p99 latency for online features is {{ $value }}s.
High Error Rate
- alert: FeastHighErrorRate
  expr: |
    sum(rate(feast_feature_server_request_total{status="error"}[5m]))
      / sum(rate(feast_feature_server_request_total[5m]))
    > 0.01
  for: 5m
  labels:
    severity: warning
  annotations:
    summary: >
      Feast feature server error rate is {{ $value | humanizePercentage }}.
Building a Grafana Dashboard
With these metrics exposed, you can build a Grafana dashboard that gives you a complete operational picture of your feature server. We’ve published a ready-to-import Grafana dashboard JSON that covers all the panels described below — import it into your Grafana instance and point it at your Prometheus datasource to get started immediately.
Connecting Prometheus to Feast
Add the Feast metrics endpoint to your Prometheus scrape configuration:
scrape_configs:
  - job_name: feast
    static_configs:
      - targets: ["<feast-host>:8000"]
    scrape_interval: 15s
Once Prometheus is scraping, verify the raw metrics output:
curl -s http://localhost:8000 | grep feast_Key PromQL Queries
Here are the most useful queries for building your own panels or running ad-hoc investigations in the Prometheus UI:
Throughput and errors:
# Request rate by endpoint
rate(feast_feature_server_request_total[5m])

# Error rate
sum(rate(feast_feature_server_request_total{status="error"}[5m]))
  / sum(rate(feast_feature_server_request_total[5m]))
Latency percentiles:
# p99 latency for online features
histogram_quantile(0.99,
  rate(feast_feature_server_request_latency_seconds_bucket{endpoint="/get-online-features"}[5m]))

# Online store read p95
histogram_quantile(0.95,
  sum(rate(feast_feature_server_online_store_read_duration_seconds_bucket[1m])) by (le))

# ODFV transform p95 by name and mode
histogram_quantile(0.95,
  sum(rate(feast_feature_server_transformation_duration_seconds_bucket[1m])) by (le, odfv_name))

# ODFV write-path transform p95 by name
histogram_quantile(0.95,
  sum(rate(feast_feature_server_write_transformation_duration_seconds_bucket[1m])) by (le, odfv_name))
Latency decomposition:
# Average total request latency
rate(feast_feature_server_request_latency_seconds_sum{endpoint="/get-online-features"}[5m])
  / rate(feast_feature_server_request_latency_seconds_count{endpoint="/get-online-features"}[5m])

# Average store read time
rate(feast_feature_server_online_store_read_duration_seconds_sum[5m])
  / rate(feast_feature_server_online_store_read_duration_seconds_count[5m])

# Average ODFV transform time
rate(feast_feature_server_transformation_duration_seconds_sum[5m])
  / rate(feast_feature_server_transformation_duration_seconds_count[5m])
Pandas vs Python comparison:
# Pandas p95
histogram_quantile(0.95,
  sum(rate(feast_feature_server_transformation_duration_seconds_bucket{mode="pandas"}[1m])) by (le))

# Python p95
histogram_quantile(0.95,
  sum(rate(feast_feature_server_transformation_duration_seconds_bucket{mode="python"}[1m])) by (le))
ML-specific signals:
# Feature freshness — views stale beyond 1 hour
feast_feature_freshness_seconds > 3600

# Materialization failure rate
rate(feast_materialization_total{status="failure"}[1h])

# Average entities per request
rate(feast_online_features_entity_count_sum[5m])
  / rate(feast_online_features_entity_count_count[5m])

# Push rate by source
rate(feast_push_request_total[5m])
Try the Automated Demo
Want to see all of this in action without manual setup? We’ve published an automated demo that deploys a Feast feature server with metrics, a Prometheus instance, and the pre-built Grafana dashboard — all with a single ./setup.sh command. It includes a traffic generator that exercises every metric category (plain online features, Pandas and Python ODFVs, push, materialize, and write-path transforms), so the dashboard populates immediately.
Kubernetes: Automatic Prometheus Discovery
For teams running Feast on Kubernetes, the Feast Operator now auto-generates a ServiceMonitor when metrics: true is set on the online store. The operator:
- Detects the
monitoring.coreos.comAPI group at startup - If present, creates a
ServiceMonitorowned by theFeatureStoreCR, targeting themetricsport (8000) - If absent (vanilla Kubernetes without Prometheus Operator), skips silently — no errors, no CRD dependency
This means on an OpenShift or Prometheus-Operator-enabled cluster, metrics discovery is fully automatic — no manual ServiceMonitor creation required. The ServiceMonitor is cleaned up automatically when the FeatureStore CR is deleted or metrics is set back to false.
For teams using KEDA for autoscaling, these Prometheus metrics also serve as scaling signals. For example, you can scale the feature server based on request rate:
apiVersion: keda.sh/v1alpha1
kind: ScaledObject
metadata:
  name: feast-scaledobject
spec:
  scaleTargetRef:
    apiVersion: feast.dev/v1
    kind: FeatureStore
    name: my-feast
  triggers:
  - type: prometheus
    metadata:
      serverAddress: http://prometheus.monitoring.svc:9090
      query: sum(rate(feast_feature_server_request_total[2m]))
      threshold: "100"
Metrics Summary
| Category | Metric | What It Answers |
|---|---|---|
| Request | feast_feature_server_request_total | What is my throughput and error rate? |
| Request | feast_feature_server_request_latency_seconds | What are my p50/p99 latencies? |
| Online Features | feast_online_features_entity_count | What is my traffic shape? |
| Store Read | feast_feature_server_online_store_read_duration_seconds | Is my online store the bottleneck? |
| ODFV Transform | feast_feature_server_transformation_duration_seconds | How expensive are my read-path transforms? |
| ODFV Transform | feast_feature_server_write_transformation_duration_seconds | How expensive are my write-path transforms? |
| Push | feast_push_request_total | Is my ingestion pipeline sending data? |
| Materialization | feast_materialization_total | Are my pipelines succeeding? |
| Materialization | feast_materialization_duration_seconds | How long do my pipelines take? |
| Freshness | feast_feature_freshness_seconds | How stale is the data my models are using? |
| Resource | feast_feature_server_cpu_usage / memory_usage | Is my server healthy? |
How Can I Get Started?
- Enable metrics:
feast serve --metricsor setmetrics.enabled: truein yourfeature_store.yaml - Verify the endpoint:
curl http://localhost:8000 - Import the dashboard: Grab the Grafana dashboard JSON and import it into your Grafana instance
- Set up alerts: Start with freshness and materialization failures — those catch the problems that affect ML model quality first
- Try the automated demo: Run the feast-prometheus-metrics setup for a one-command local experience
- Check out the Feast documentation for the full configuration reference
- Join the Feast Slack to share feedback and ask questions
We’re excited to bring production-grade observability to Feast and welcome feedback from the community!