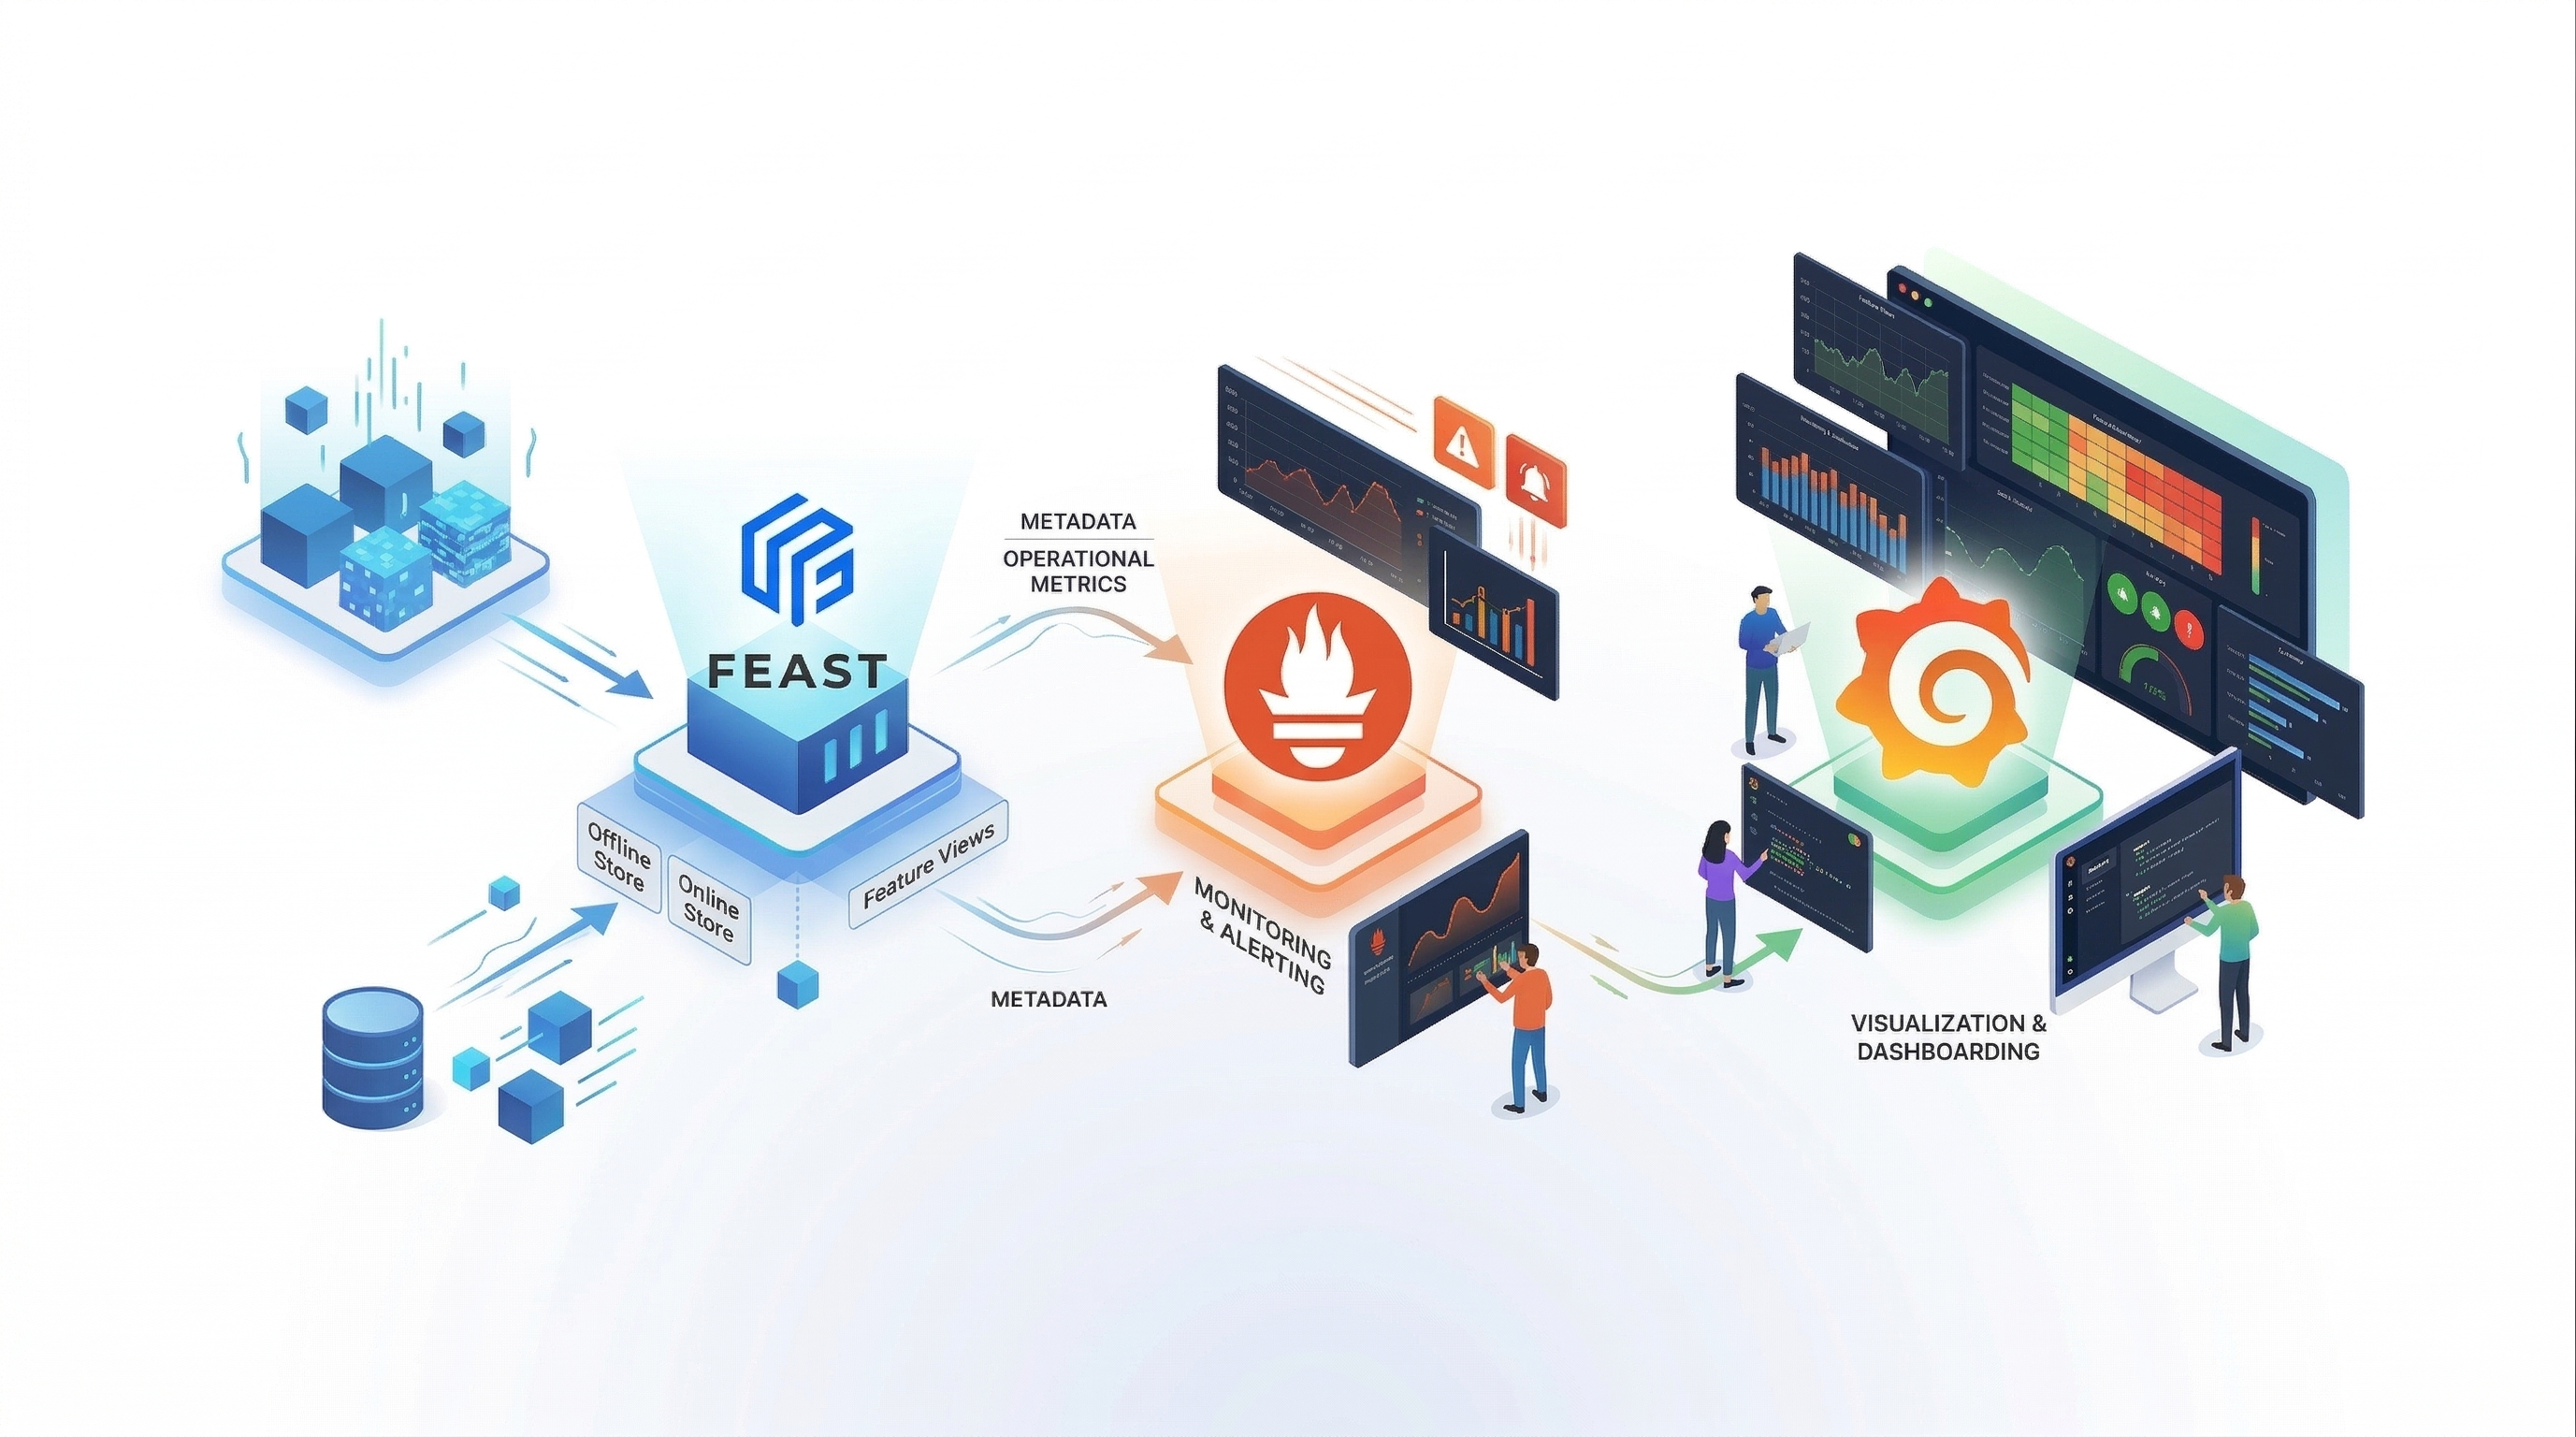
Extending Feast Observability: Offline Store Metrics and SOX Audit Logging
In our previous post, we introduced built-in Prometheus metrics for the Feast feature server — covering the full online serving lifecycle from HTTP request handling through online store reads, on-demand feature transformations, materialization pipelines, and feature freshness tracking.
That covered the online path. But production ML systems don’t just serve features in real time — they also build training datasets through offline store retrievals. And for teams operating in regulated environments (financial services, healthcare, government), observability isn’t enough. You need an auditable record of who accessed what data, when, and how much.
This post covers two new capabilities added to Feast:
- Offline Store RED Metrics — Prometheus counters and histograms for offline store retrieval operations (request rate, error rate, latency, row counts)
- SOX Audit Logging — Structured JSON audit log entries for both online and offline feature retrieval paths, routed to a dedicated
feast.auditlogger
Together, these close the observability gap between online and offline operations and give compliance teams the structured audit trail they need.
Offline Store Metrics: Closing the Observability Gap
The online feature server already had comprehensive metrics, but the offline store — where get_historical_features queries execute against your data warehouse to build training datasets — had zero instrumentation. This matters because training-serving skew, stalled pipelines, and data volume anomalies all originate in the offline path.
The Problem
Without offline store metrics, teams faced three blind spots:
- Silent training failures — An offline retrieval that returns incomplete data (or errors out) produces a corrupted training dataset. Models trained on bad data degrade in production, and without metrics, there’s no signal until prediction quality drops.
- Invisible pipeline stalls — A
get_historical_featurescall that normally takes 30 seconds but suddenly takes 10 minutes looks like a “hang” from the orchestrator’s perspective. No latency metrics means no alerting until the pipeline times out. - Data volume anomalies — If a typical training query returns 500K rows but suddenly returns 50K, something changed upstream. Without row count tracking, this silently propagates into model training.
How Feast Solves It
Feast now automatically captures RED metrics (Rate, Errors, Duration) for every offline store retrieval — regardless of the backend. Whether you’re running against BigQuery, Redshift, Snowflake, DuckDB, or local files, you get the same three Prometheus metrics out of the box:
feast_offline_store_request_total— Counts every retrieval, labeled by success/error. Set an alert and know immediately when training pipelines start failing.feast_offline_store_request_latency_seconds— Latency histogram with buckets tuned for offline workloads (0.1sto10min). Set SLOs and catch slow queries before pipelines time out.feast_offline_store_row_count— Row count histogram covering100to5Mrows. Detect data volume anomalies before they reach model training.
Metrics collection never interferes with your queries — if the metrics path fails for any reason, your offline retrieval completes normally.
# Alert when offline retrievals start failing
- alert: FeastOfflineStoreErrors
  expr: rate(feast_offline_store_request_total{status="error"}[15m]) > 0
  for: 5m
  labels:
    severity: critical
  annotations:
    summary: >
      Offline store retrievals are failing ({{ $value }} errors/sec).
      Training pipelines may be producing incomplete datasets.
Why SOX Audit Logging Matters
For organizations subject to SOX (Sarbanes-Oxley), GDPR, HIPAA, or other regulatory frameworks, you need to answer questions like:
- Who accessed customer features at 3:47 PM on March 15th?
- Which feature views were involved in the training dataset built yesterday?
- How many rows of PII-adjacent data were retrieved by the batch scoring pipeline?
Before this change, answering these questions required parsing unstructured application logs and correlating timestamps across services. Feature stores sit at the intersection of data access and ML model behavior — yet most have no structured audit trail.
Feast now emits structured JSON audit entries for both online and offline retrieval paths, routed to a dedicated feast.audit logger that can be independently sent to your SIEM, log aggregator, or compliance sink — without touching your operational log pipeline.
What makes this production-ready:
- PII-minimized by design. Entity key names are logged, not values. A compliance auditor sees “the ML pipeline accessed
user_idfeatures fromtransaction_featuresat 3:47 PM” without the log itself containing PII. - Dedicated logger. Audit entries go to
feast.audit, separate from the application logger. Route them to a SOX-compliant sink (Splunk, ELK with retention policies, S3 with WORM locks) independently. - Never breaks your serving path. Audit logging is best-effort — a broken audit sink never affects feature serving latency or availability.
- Zero overhead when disabled.
audit_loggingdefaults tofalse. Enable it only when you need it.
The New Metrics
Offline Store RED Metrics
| Metric | Type | Labels | What It Answers |
|---|---|---|---|
feast_offline_store_request_total | Counter | method, status | What is my offline retrieval throughput and error rate? |
feast_offline_store_request_latency_seconds | Histogram | method | How long are my training data queries taking? |
feast_offline_store_row_count | Histogram | method | How much data are my offline retrievals returning? |
The method label captures the retrieval type (to_arrow), and status is success or error. The latency histogram uses wide buckets tuned for offline workloads: 0.1s, 0.5s, 1s, 5s, 10s, 30s, 60s, 2min, 5min, 10min — because offline queries can range from sub-second (small entity sets against local files) to minutes (large point-in-time joins against BigQuery or Redshift).
The row count histogram uses exponential buckets: 100, 1K, 10K, 100K, 500K, 1M, 5M — covering the range from small test retrievals to production training datasets.
SOX Audit Log Entries
Online feature request audit entry:
{
"event": "online_feature_request",
"timestamp": "2026-06-07T14:42:29.739Z",
"requestor_id": "service-account:ml-pipeline",
"entity_keys": ["driver_id"],
"entity_count": 5,
"feature_views": ["driver_hourly_stats"],
"feature_count": 3,
"status": "success",
"latency_ms": 12.45
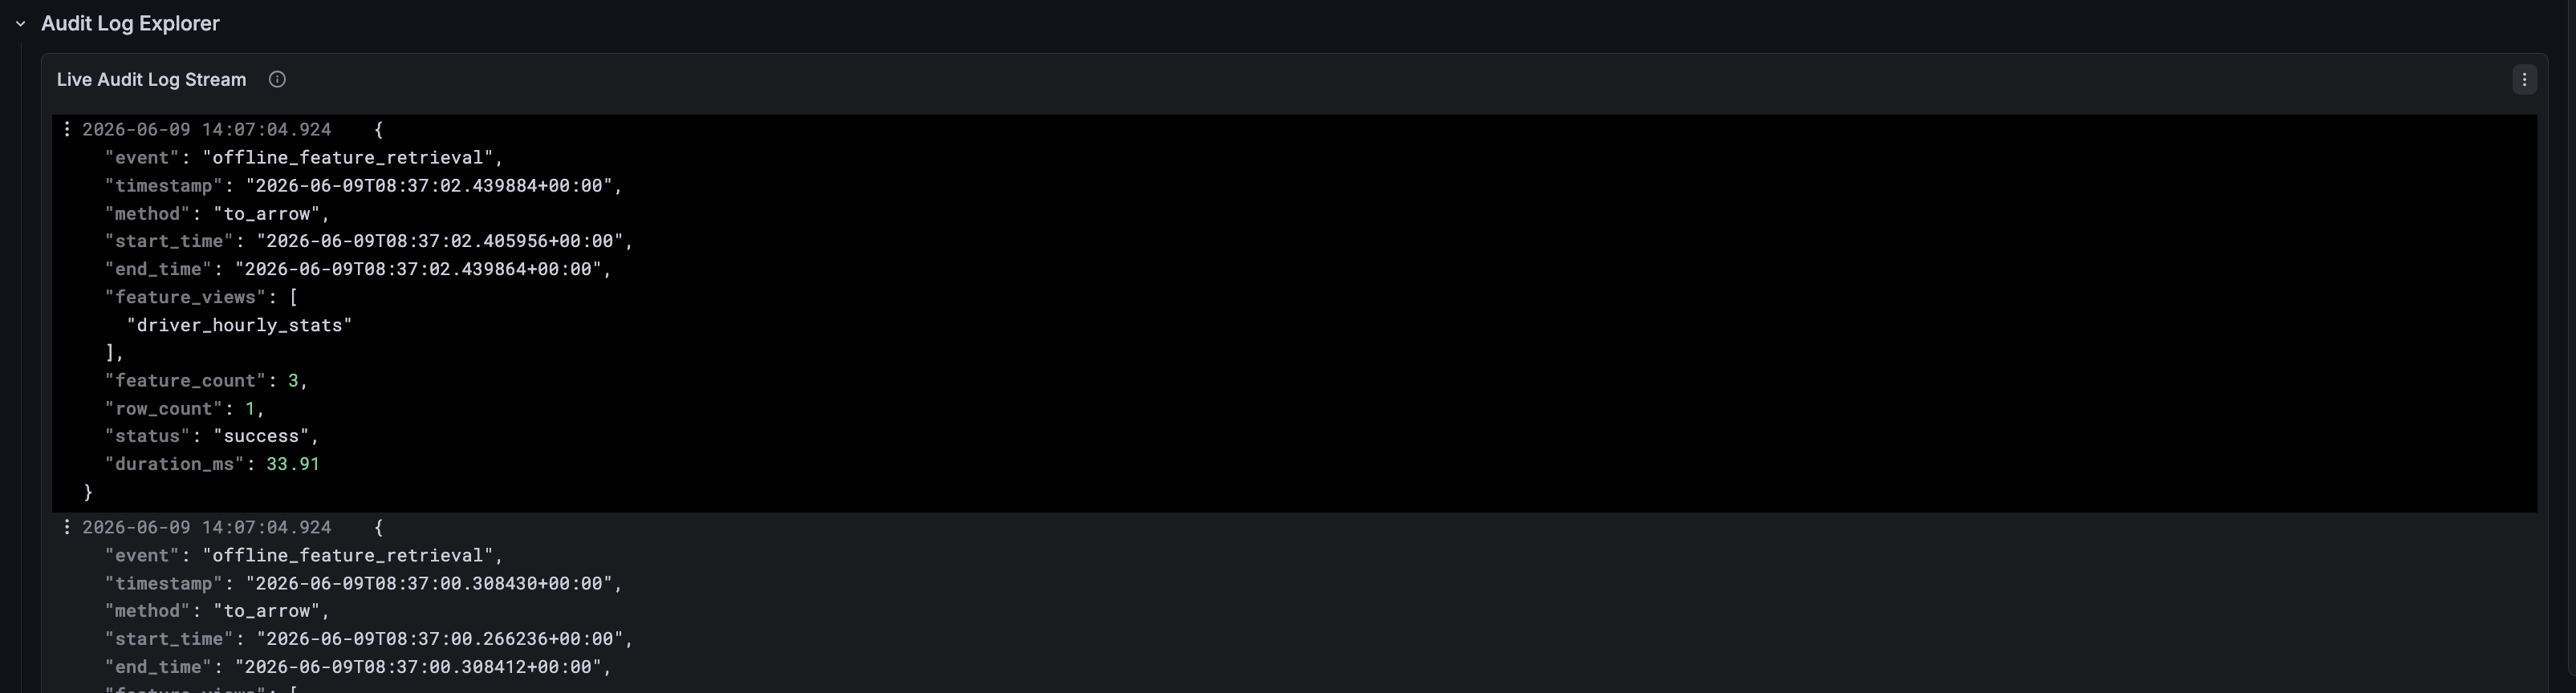
}Offline feature retrieval audit entry:
{
    "event": "offline_feature_retrieval",
    "timestamp": "2026-06-07T14:42:29.739Z",
    "method": "to_arrow",
    "start_time": "2026-06-07T14:42:29.697Z",
    "end_time": "2026-06-07T14:42:29.739Z",
    "feature_views": ["driver_hourly_stats"],
    "feature_count": 3,
    "row_count": 150000,
    "status": "success",
    "duration_ms": 42.39
}
Each entry is a single JSON line, making it trivial to parse with jq, ingest into Elasticsearch, or stream to a Kafka topic for compliance processing.
Note on accessor identity: Online audit entries include requestor_id, extracted from the Feast authentication layer (SecurityManager). Offline retrievals run as direct SDK calls in the user’s own process (a notebook, Airflow task, or training script) — there is no server in the middle to extract auth context. In production SOX environments, offline accessor identity is typically established at the infrastructure level: the Kubernetes service account running the job, the IAM role accessing the data warehouse, or the CI/CD pipeline identity. A future enhancement could optionally capture identity from os.getenv("USER") or an explicit SDK parameter.
Enabling the New Metrics
YAML Configuration
Add offline_features and audit_logging to your feature_store.yaml:
feature_server:
  metrics:
    enabled: true
    resource: true
    request: true
    online_features: true
    push: true
    materialization: true
    freshness: true
    offline_features: true    # NEW: Offline store RED metrics
    audit_logging: true       # NEW: SOX audit log entries
offline_features defaults to true when metrics are enabled (consistent with other categories). audit_logging defaults to false — it’s opt-in because audit entries have a non-trivial cost (JSON serialization + I/O per request) and are only needed in regulated environments.
CLI
When using feast serve --metrics, offline store metrics are enabled by default. Audit logging still requires the YAML toggle since it’s opt-in.
Routing Audit Logs
The feast.audit logger is a standard Python logger. Configure it like any other:
import logging

audit_logger = logging.getLogger("feast.audit")
audit_logger.setLevel(logging.INFO)
audit_logger.propagate = False

handler = logging.FileHandler("/var/log/feast/audit.log")
handler.setFormatter(logging.Formatter("%(message)s"))
audit_logger.addHandler(handler)
Or route to a JSON-aware sink in production:
# logging.yaml for production
loggers:
  feast.audit:
    level: INFO
    propagate: false
    handlers: [audit_file, splunk_forwarder]
Key PromQL Queries for Offline Store
Throughput and errors:
# Offline retrieval rate
rate(feast_offline_store_request_total[5m])

# Offline error rate
sum(rate(feast_offline_store_request_total{status="error"}[5m]))
  / sum(rate(feast_offline_store_request_total[5m]))
Latency percentiles:
# Offline retrieval p95 latency
histogram_quantile(0.95,
  sum(rate(feast_offline_store_request_latency_seconds_bucket[5m])) by (le))

# Average offline retrieval duration
rate(feast_offline_store_request_latency_seconds_sum[5m])
  / rate(feast_offline_store_request_latency_seconds_count[5m])
Row count analysis:
# Average rows per retrieval
feast_offline_store_row_count_sum / feast_offline_store_row_count_count

# p95 row count (detect large retrievals)
histogram_quantile(0.95,
  sum(rate(feast_offline_store_row_count_bucket[5m])) by (le))
Building Alerts for Offline Store
Offline Retrieval Failures
- alert: FeastOfflineStoreErrors
  expr: rate(feast_offline_store_request_total{status="error"}[15m]) > 0
  for: 5m
  labels:
    severity: critical
  annotations:
    summary: >
      Offline store retrievals are failing.
      Training pipelines may be producing incomplete datasets.
Slow Offline Queries
- alert: FeastOfflineStoreSlowQuery
  expr: |
    histogram_quantile(0.95,
      sum(rate(feast_offline_store_request_latency_seconds_bucket[5m])) by (le)
    ) > 300
  for: 5m
  labels:
    severity: warning
  annotations:
    summary: >
      Offline store p95 latency is {{ $value | humanizeDuration }}.
      Training pipelines may be stalling.
Row Count Anomaly
- alert: FeastOfflineStoreRowCountDrop
  expr: |
    feast_offline_store_row_count_sum / feast_offline_store_row_count_count
    < 0.5 * avg_over_time(
      (feast_offline_store_row_count_sum / feast_offline_store_row_count_count)[1d:1h])
  for: 10m
  labels:
    severity: warning
  annotations:
    summary: >
      Average rows per offline retrieval dropped by >50%.
      Possible upstream data issue.
The Extended Grafana Dashboard
We’ve extended the existing Feast Grafana dashboard with a dedicated Offline Store section containing six new panels:
- Offline Store Request Rate — Rate of offline retrievals by method and status
- Offline Store Total Requests — Cumulative request counts (stat panel)
- Offline Store Retrieval Latency (p50/p95/p99) — Latency percentile time series
- Offline Store Row Count Distribution — Row count percentiles over time
- Avg Offline Retrieval Duration — Average duration per method
- Offline Store Error Rate — Gauge showing current error percentage with threshold coloring
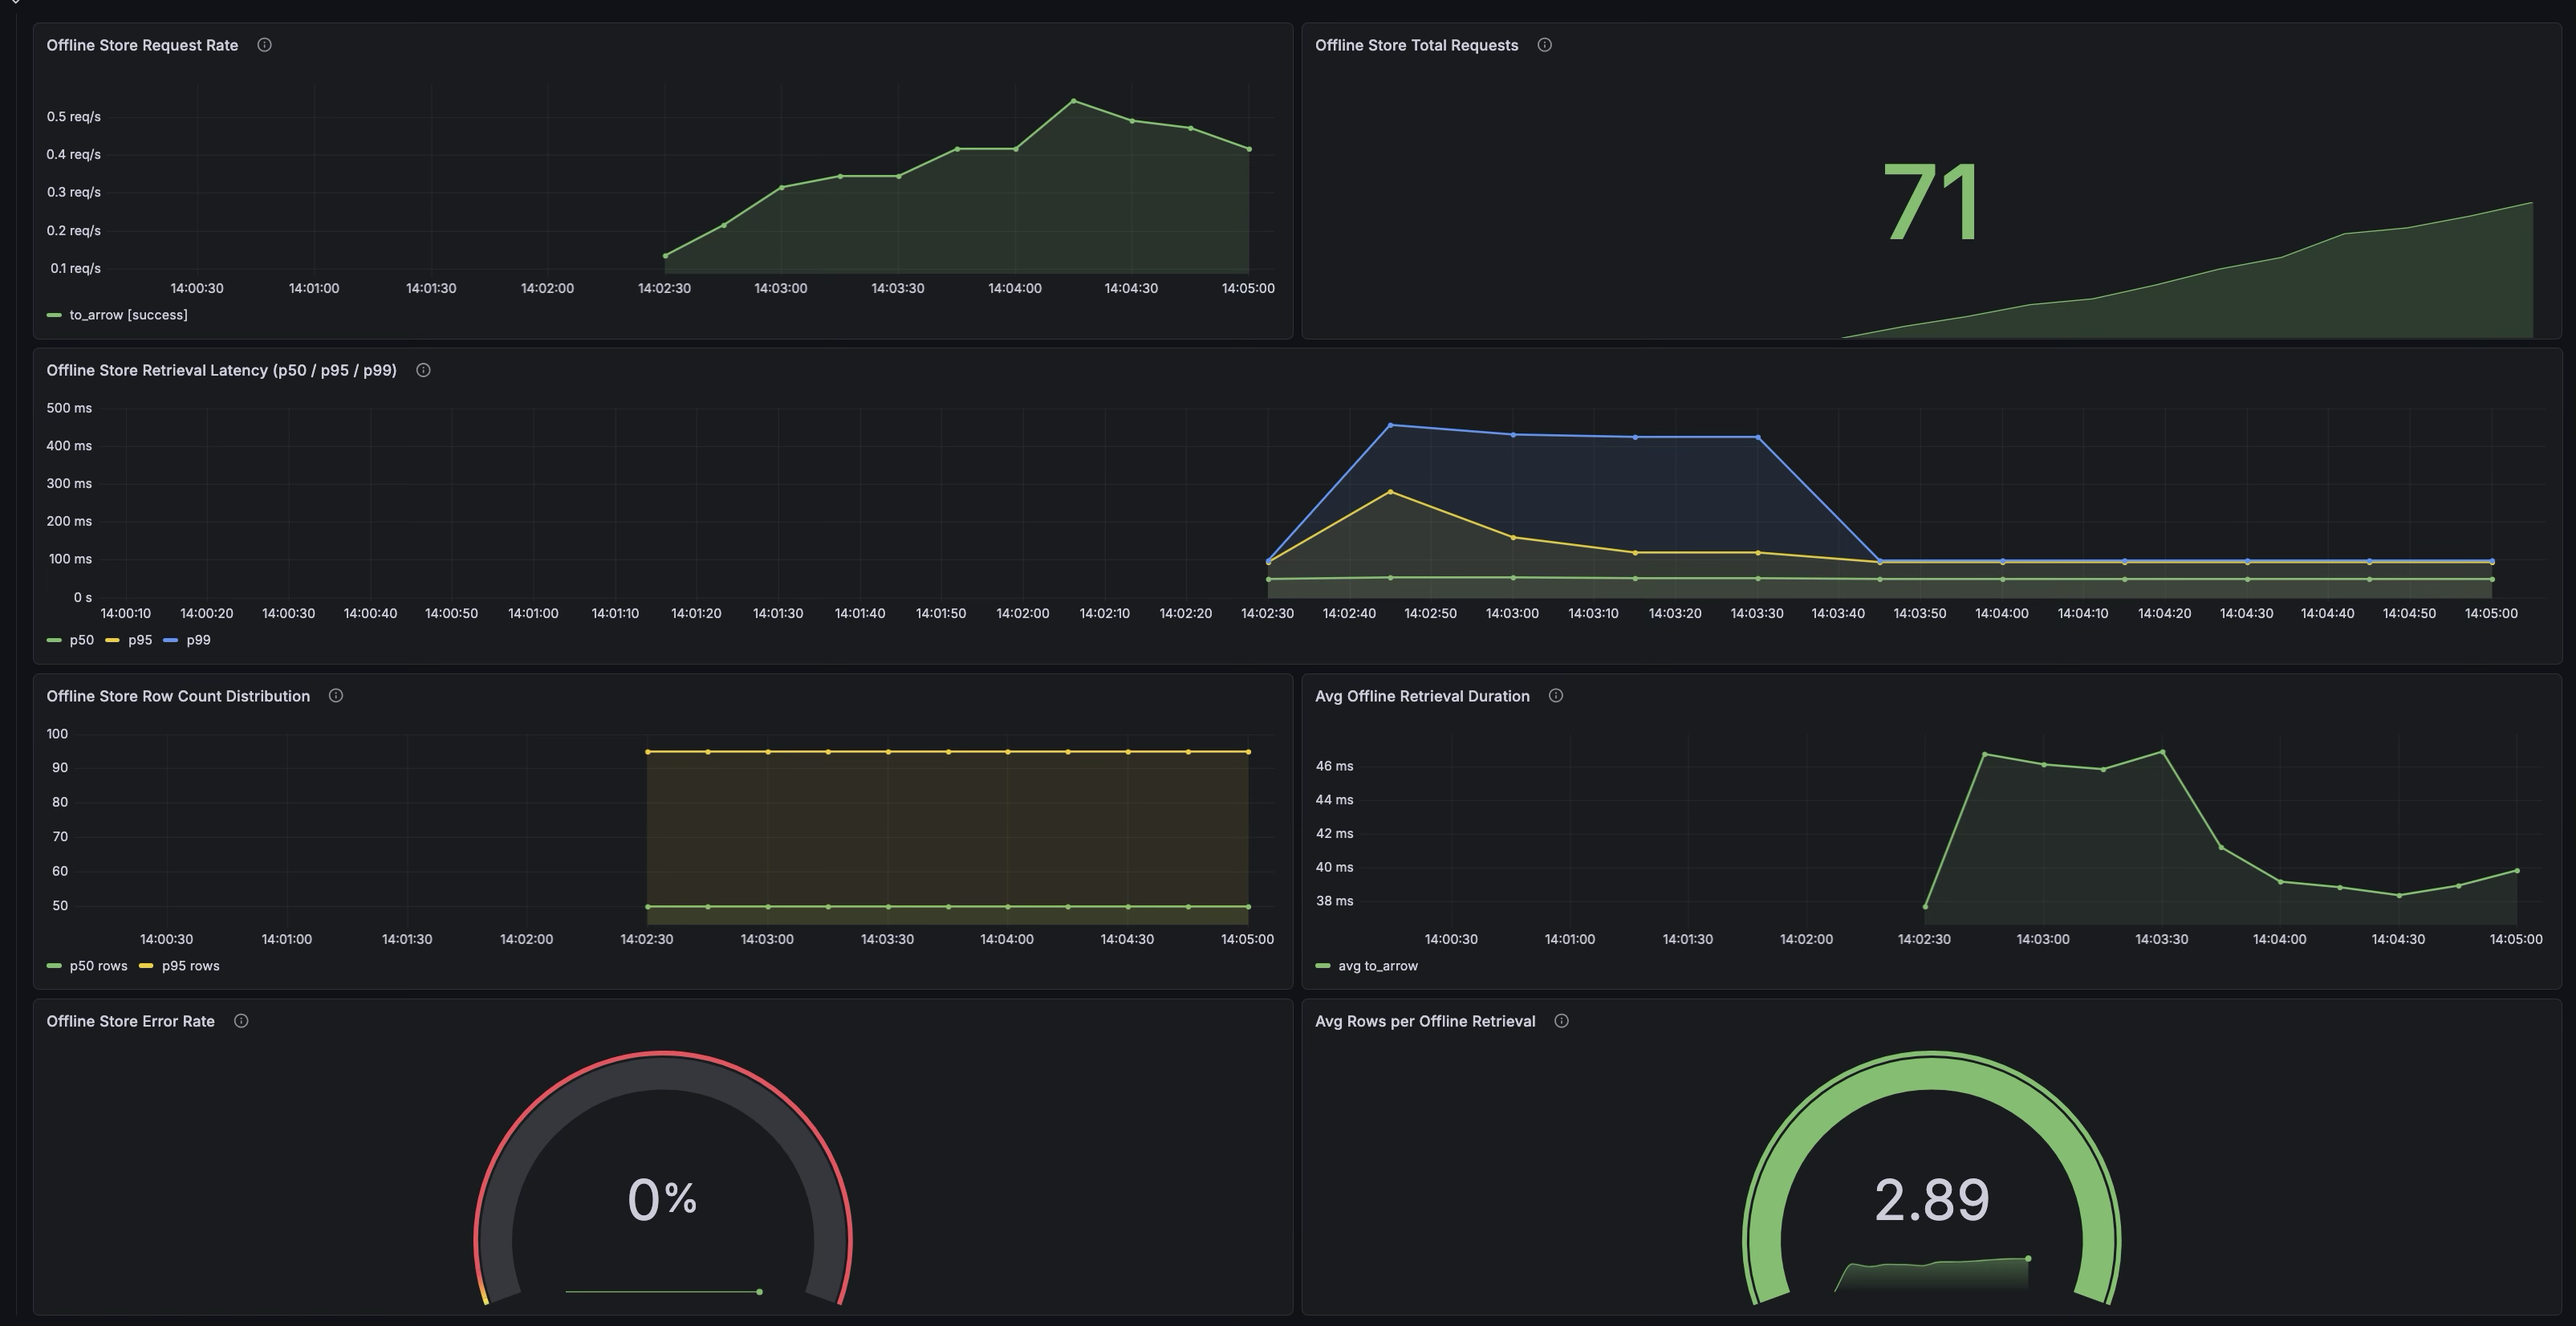
These panels sit alongside the existing online store panels, giving you a single dashboard that covers both serving paths.
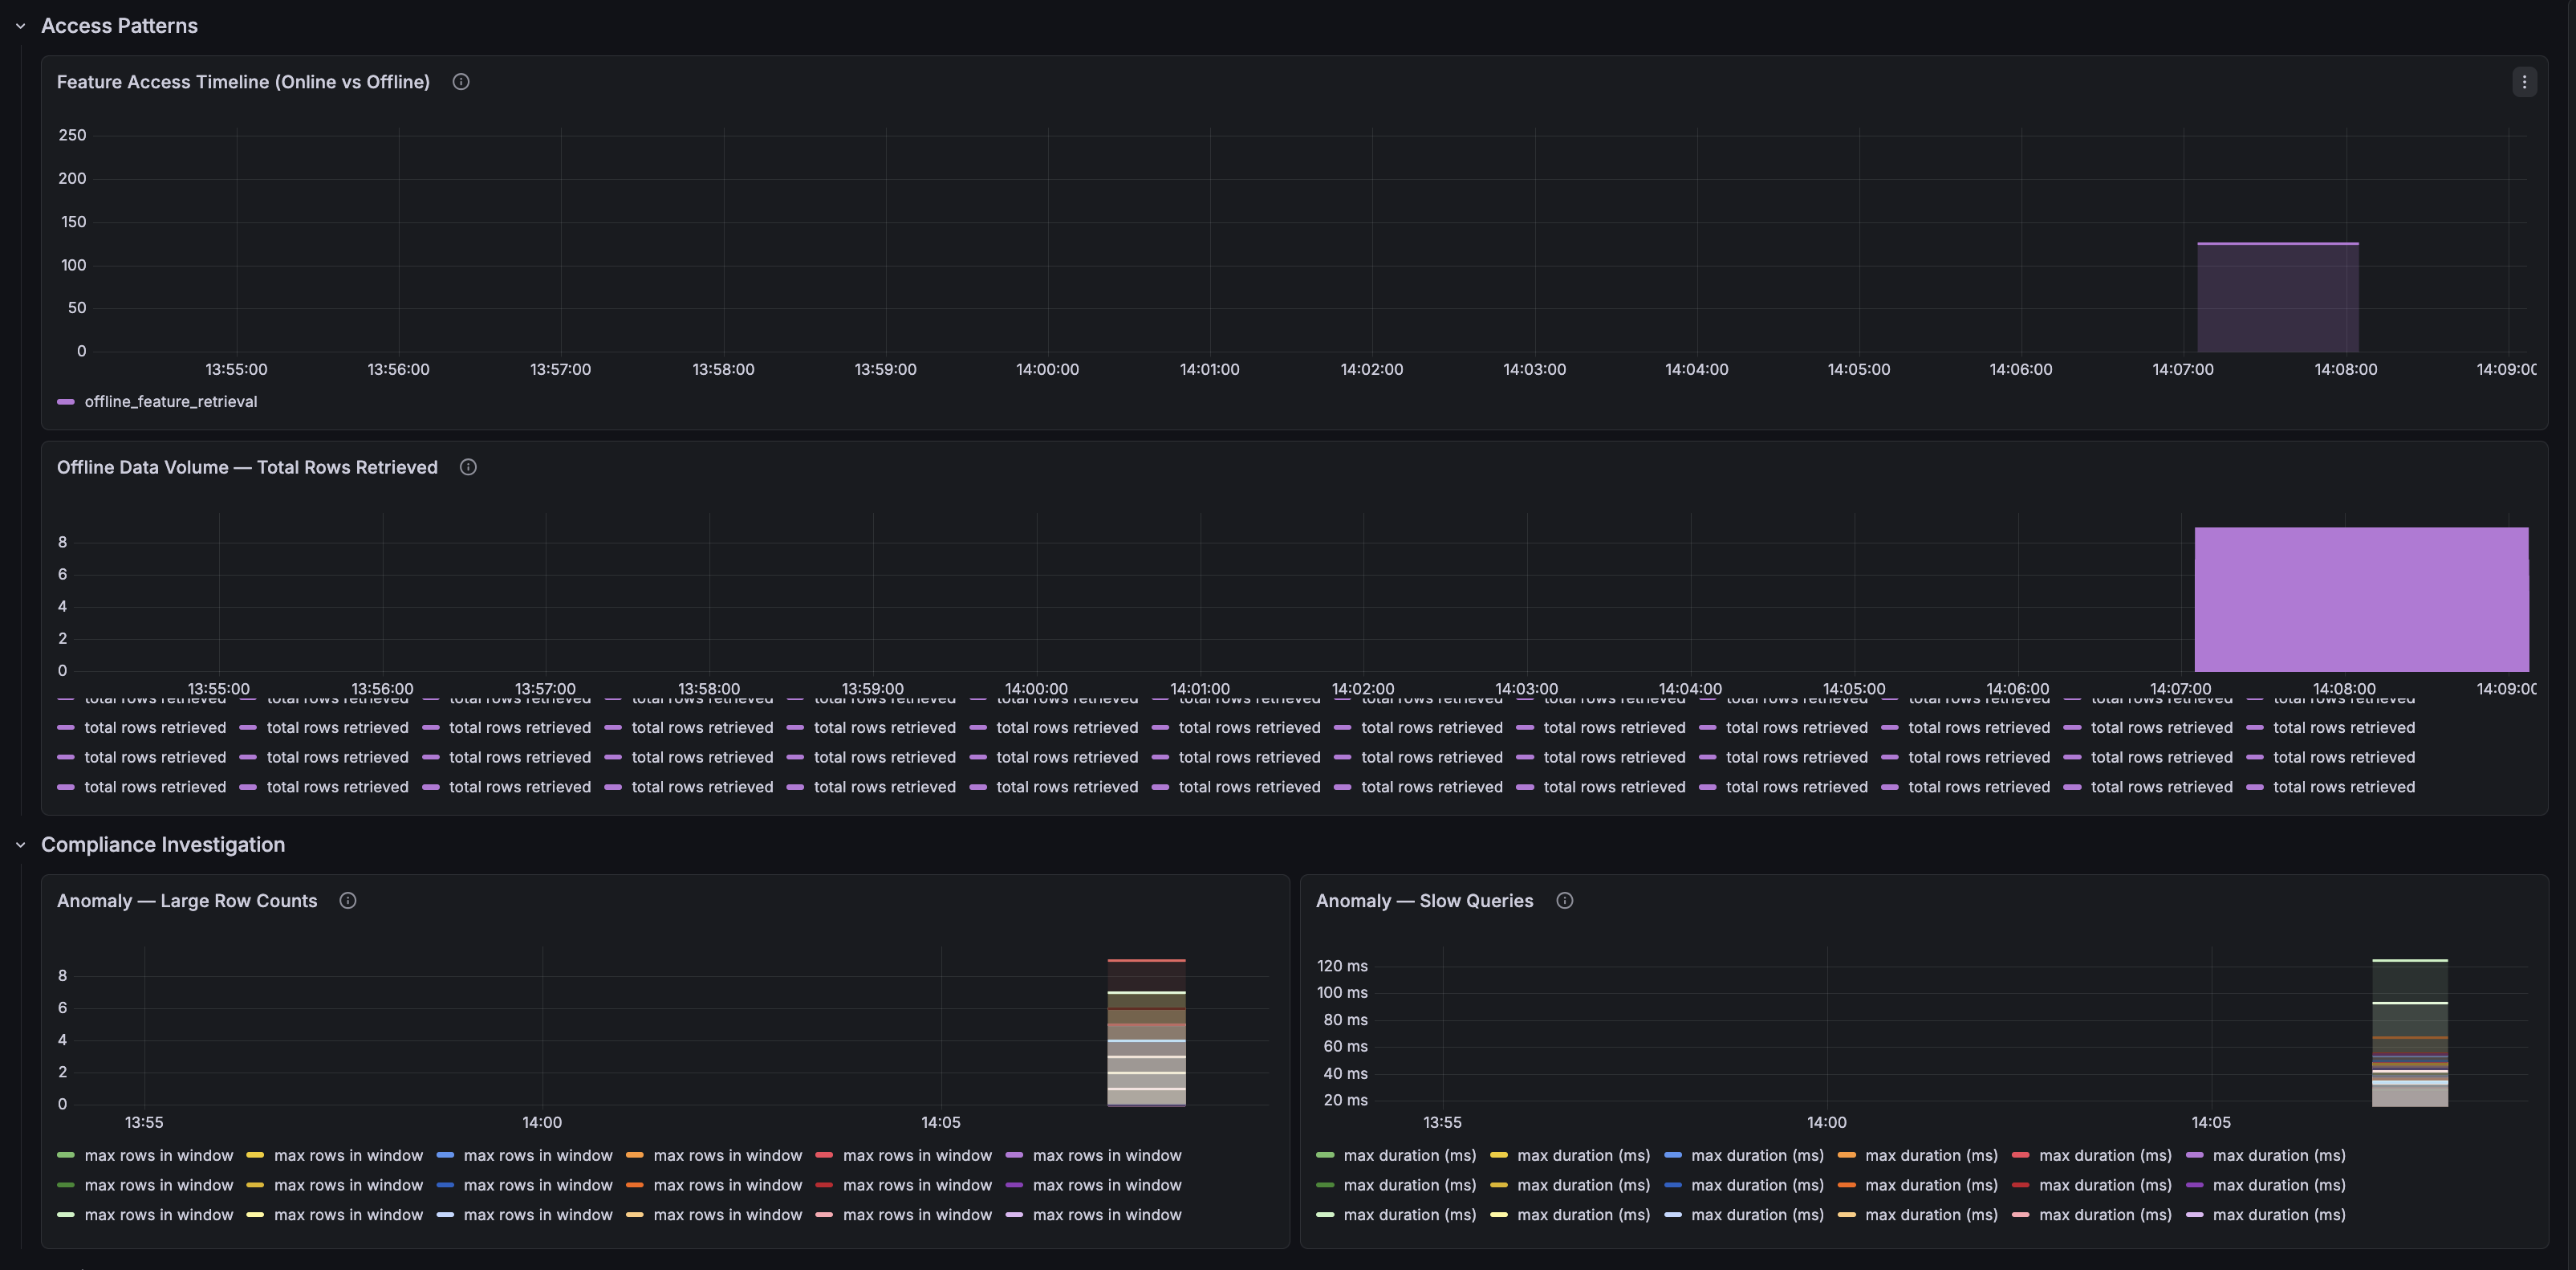
For SOX compliance, a separate Audit Trail dashboard powered by Loki visualizes:
-
Total Audited Events — Count of all audited access events
-
Online vs Offline Access Timeline — Stacked time series showing access patterns
-
Offline Data Volume — Total rows retrieved over time, flagging bulk data exports
-
Anomaly Detection — Large row counts and slow queries that may need compliance review
-
Live Audit Log Stream — Raw structured audit entries, expandable for investigation
Updated Metrics Summary
| Category | Metric | What It Answers |
|---|---|---|
| Online Request | feast_feature_server_request_total | What is my online throughput and error rate? |
| Online Request | feast_feature_server_request_latency_seconds | What are my online p50/p99 latencies? |
| Online Features | feast_online_features_entity_count | What is my online traffic shape? |
| Online Store Read | feast_feature_server_online_store_read_duration_seconds | Is my online store the bottleneck? |
| ODFV Transform | feast_feature_server_transformation_duration_seconds | How expensive are my read-path transforms? |
| ODFV Transform | feast_feature_server_write_transformation_duration_seconds | How expensive are my write-path transforms? |
| Push | feast_push_request_total | Is my ingestion pipeline sending data? |
| Materialization | feast_materialization_total | Are my pipelines succeeding? |
| Materialization | feast_materialization_duration_seconds | How long do my pipelines take? |
| Freshness | feast_feature_freshness_seconds | How stale is the data my models are using? |
| Resource | feast_feature_server_cpu_usage / memory_usage | Is my server healthy? |
| Offline Request | feast_offline_store_request_total | What is my offline retrieval throughput? |
| Offline Latency | feast_offline_store_request_latency_seconds | How long are my training queries taking? |
| Offline Row Count | feast_offline_store_row_count | How much data are retrievals returning? |
| Audit | feast.audit logger (online) | Who requested which features, when? |
| Audit | feast.audit logger (offline) | Which training datasets were built, with how much data? |
How to Try It
Automated Demo
We’ve extended the feast-prometheus-metrics automated demo to include offline store metrics and SOX audit logging. The extended traffic generator exercises both online and offline paths:
# Clone and run
git clone https://github.com/ntkathole/feast-automated-setups.git
cd feast-automated-setups/feast-prometheus-metrics

# Run setup (uses feast from your environment)
./setup.sh

# Generate extended traffic including offline retrievals
python3 generate_traffic_extended.py \
    --url http://localhost:6566 \
    --duration 120 \
    --repo-path workspace/feast_demo/feature_repo \
    --log-dir workspace/logs
After traffic generation, check the audit log:
# View structured audit entries
cat workspace/logs/feast_audit.log | python3 -m json.tool

# Count by event type
cat workspace/logs/feast_audit.log | \
  python3 -c "import sys,json; events=[json.loads(l)['event'] for l in sys.stdin]; print({e:events.count(e) for e in set(events)})"
Manual Verification
Verify offline store metrics are being emitted:
# Check the Prometheus metrics endpoint for offline store metrics
curl -s http://localhost:8000 | grep feast_offline

# Query Prometheus directly
curl -s 'http://localhost:9090/api/v1/query?query=feast_offline_store_request_total'
Enable in Your Deployment
- Update
feature_store.yaml— Addoffline_features: trueandaudit_logging: trueto the metrics block - Configure audit log routing — Set up a handler for the
feast.auditlogger in your logging config - Import the updated Grafana dashboard — Add the offline store panels to your existing dashboard
- Set up alerts — Start with offline retrieval failures and row count anomalies
We’re excited to bring full-lifecycle observability to Feast — covering both the real-time serving path and the batch training path — and welcome feedback from the community!
References: